State of Charge (SOC) Drift and Battery Calibration on Portable Power Stations

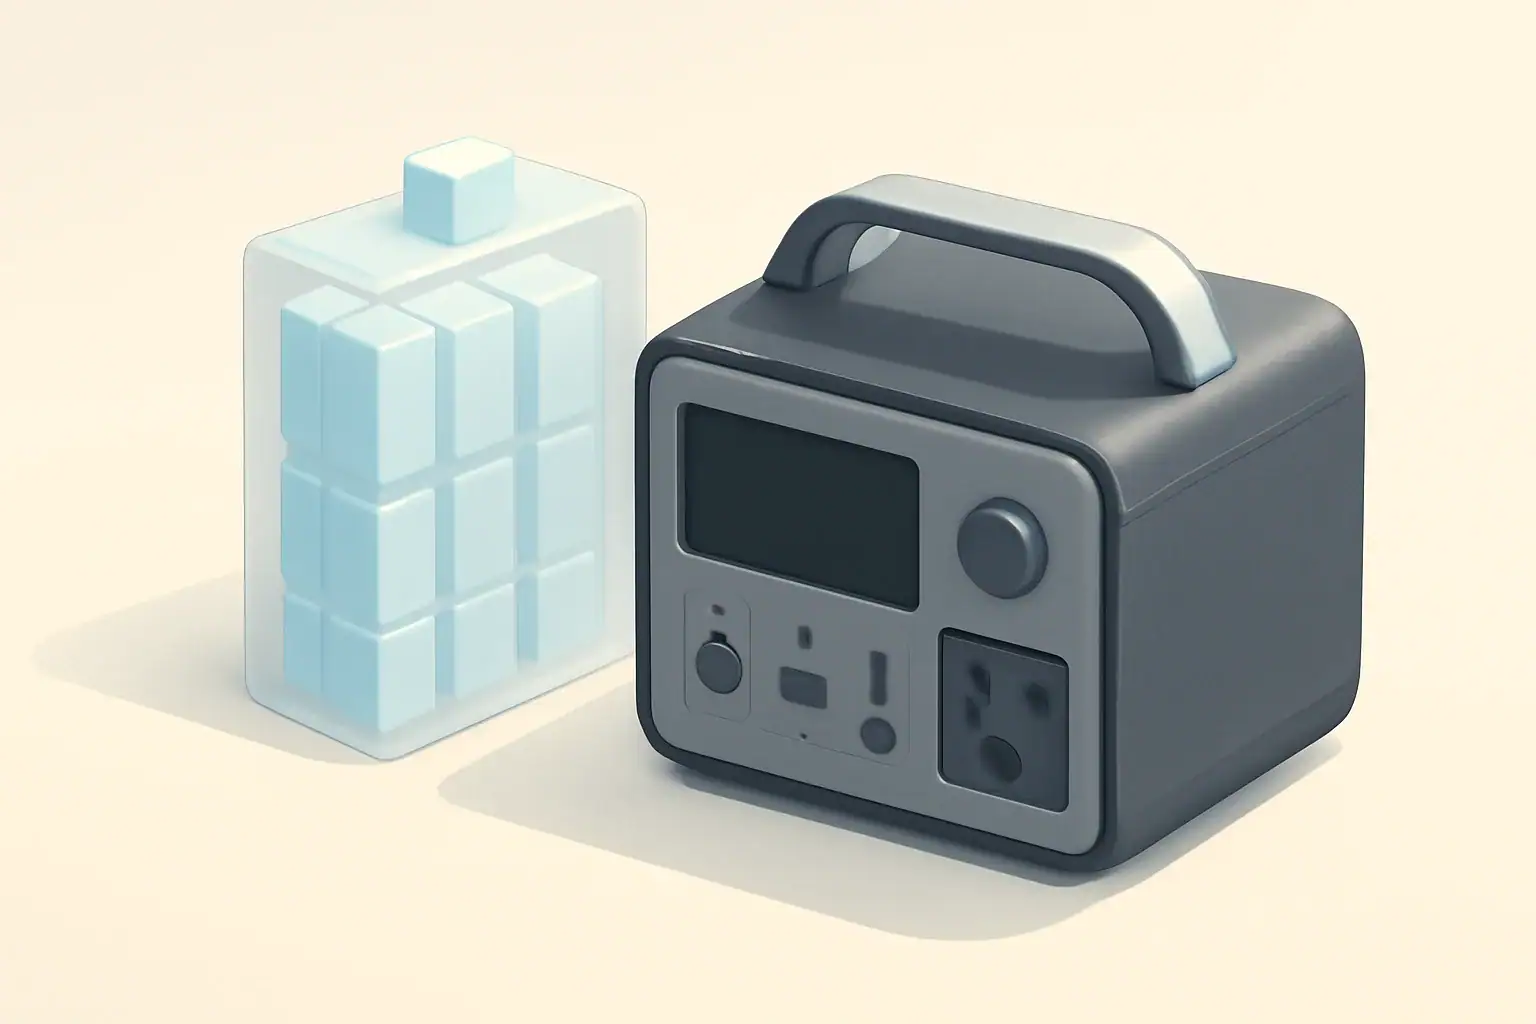
Isometric illustration of portable power station and internal battery cells

State of charge (SOC) on a portable power station drifts because the battery percentage is an estimate, not a direct measurement of remaining energy. The battery management system relies on sensors and models that slowly become less accurate as the battery ages, temperature changes, and usage patterns vary.

That is why you may see the SOC drop quickly from 100% to 90%, why a unit can shut off while it still shows 5–10% remaining, or why runtime at 50% sometimes feels longer or shorter. Understanding SOC drift and battery calibration helps you plan runtimes, avoid surprises, and interpret the battery percentage as a useful guide instead of a perfect fuel gauge.

This guide explains what SOC really means, how portable power stations estimate it, how drift shows up in real-world use, and the simple steps you can take to keep readings reasonably accurate over the life of the battery.

What State of Charge Actually Means and Why It Matters

State of charge is a way of describing how full a battery is compared with its usable capacity. On a portable power station, SOC is usually shown as a percentage or a bar graph, but it always refers to the same idea: how much energy you can still take out before the battery reaches its safe lower limit.

In practical terms:

  • 100% SOC: The battery is at its allowed upper charge limit.
  • 0% SOC: The battery has reached its allowed lower discharge limit.
  • 50% SOC: Roughly half of the usable capacity is available, not half of the cell’s absolute chemistry limit.

Portable power stations never use the full chemical capacity of the cells. The battery management system (BMS) reserves a safety margin at the top and bottom of the range to protect the battery from overcharge and deep discharge. The SOC you see on the screen is already adjusted for these safety margins.

This matters because SOC is at the center of several everyday questions:

  • Will the battery last through the night with a fridge or CPAP machine?
  • Is there enough charge left to run a power tool for one more job?
  • Can I trust the 10% reading, or will the unit shut off early?

Knowing that SOC is an estimate, and understanding what it is estimating, helps you interpret that number realistically instead of expecting it to behave like a perfectly linear fuel gauge.

Key Concepts: How Portable Power Stations Estimate SOC

Portable power stations cannot directly measure “watt-hours remaining” inside the battery. Instead, the BMS combines several methods and assumptions to estimate SOC. Each method has strengths and weaknesses, and SOC drift happens when these methods slowly move away from the battery’s real behavior.

Voltage-Based Estimation

The simplest method uses battery voltage. A charged lithium-ion or LiFePO4 battery has a higher voltage than a discharged one. The BMS measures pack voltage and compares it to an internal table that maps voltage to SOC.

However, voltage is influenced by more than just charge level:

  • Load current: High loads cause voltage sag, making the battery look emptier than it really is.
  • Temperature: Cold batteries show lower voltage; warm batteries show slightly higher voltage.
  • Chemistry: Different chemistries have different voltage curves, especially LiFePO4, which is very flat through much of its range.
  • Rest time: Voltage recovers after the load is removed, so readings taken immediately under load differ from readings at rest.

Because of these factors, voltage alone is too noisy for accurate SOC across all conditions, especially in the middle of the discharge curve where voltage changes slowly.

Coulomb Counting (Current Integration)

To improve accuracy, many power stations use coulomb counting. The BMS measures current going into and out of the battery and keeps a running total of how many amp-hours have been added or removed.

Conceptually, the BMS:

  • Adds charge to an internal counter when the unit is charging.
  • Subtracts charge from that counter when the unit is discharging.
  • Converts the counter value into a percentage based on an assumed usable capacity.

Coulomb counting is usually more accurate than voltage alone over a short period, but it is not perfect:

  • Small sensor errors accumulate over dozens of cycles.
  • Usable capacity changes as the battery ages or is used in different temperatures.
  • Slow self-discharge during storage may not be fully captured.

Hybrid Algorithms and Battery Models

Most modern portable power stations use a hybrid approach that blends coulomb counting, voltage measurements, temperature readings, and a battery model stored in firmware. The model describes how a “typical” pack of that chemistry should behave.

Typical behavior of these hybrid systems:

  • During active use, SOC mainly follows coulomb counting, with efficiency corrections.
  • When the unit is idle, the BMS compares resting voltage to its model and may nudge the SOC estimate up or down.
  • At clear reference points, such as a stable full charge or automatic low-voltage shutdown, the BMS resets its internal idea of 100% or 0% SOC.

Every real battery deviates slightly from the model, and the battery itself changes over time. The gap between the model and reality is what shows up as SOC drift.

Estimation method Main input Strengths Limitations
Voltage-based Pack voltage Simple, works without history, useful near full or empty Strongly affected by load and temperature; poor mid-range accuracy
Coulomb counting Charge in/out over time Good short-term accuracy, tracks partial cycles Errors accumulate; assumes fixed usable capacity
Hybrid model Voltage, current, temperature, history Best overall accuracy; can self-correct at reference points Still approximate; depends on model quality and calibration
How common SOC estimation methods compare in portable power stations. Example values for illustration.

Real-World SOC Drift: What You Actually See

SOC drift is the gradual mismatch between the displayed battery percentage and the true remaining capacity. It does not usually appear as a single sudden failure, but as patterns you notice over time when you rely on your power station for real tasks.

Nonlinear Percentage Drop During Use

One of the most common observations is that the first few percent seem to disappear quickly, then the SOC drops slowly for a long time, and finally it falls rapidly again near the bottom. This happens even on new units.

Typical reasons include:

  • The natural shape of the lithium-ion or LiFePO4 voltage curve.
  • The BMS smoothing and averaging readings to avoid jumpy numbers.
  • Different loads at different times, such as a brief high-wattage appliance at the start of a discharge.

Even with a well-calibrated system, SOC is not expected to move in a perfectly straight line from 100% to 0%.

Early Shutdown While SOC Still Shows Remaining Charge

Another frequent complaint is that the power station shuts off with 5–15% still showing on the display. In most cases, this is not an immediate sign of a defective battery. Instead, it usually means:

  • The battery hit its low-voltage cutoff under the current load.
  • The true usable capacity is now lower than the BMS assumes, often because of aging or cold temperatures.
  • The SOC algorithm has drifted and is overestimating remaining energy, especially near the bottom of the range.

After shutdown, voltage may recover slightly, and the display can still show a nonzero percentage when you power the unit on, but the BMS will not allow further discharge to protect the cells.

Different Runtime at the Same SOC

Users also notice that “50% remaining” does not always give the same runtime. For example, 50% might run a 60 W fridge for several hours one day, but only a short time with a space heater or in cold weather.

Key factors include:

  • Load level: Higher wattage increases internal losses and voltage sag, effectively reducing usable capacity.
  • Temperature: Cold conditions reduce available capacity; heat can temporarily increase it while accelerating aging.
  • Recent usage: A battery that has just been heavily loaded may show more sag and reach cutoff earlier at the same SOC.

SOC is a snapshot of remaining charge, not a guarantee of specific runtime. Runtime always depends on power draw and conditions.

Calibration Cycles in Practice

Many power stations can improve their SOC accuracy when you occasionally run a full calibration-style cycle. A basic pattern looks like this:

  • Charge to 100% and let the unit rest at full for some time.
  • Discharge under a moderate, steady load until the unit shuts off or reaches a very low SOC.
  • Recharge back to 100% in one continuous session if possible.

This does not restore lost capacity, but it gives the BMS clear “top” and “bottom” reference points so it can better match the model to reality.

Observed behavior Likely cause Simple user action
Shuts off at 8–10% SOC under a heavy load Voltage sag and SOC overestimation near empty Try a calibration cycle with a moderate load at room temperature
Percentage drops fast from 100% to 90%, then slows Top-of-charge correction and smoothing behavior Consider this normal; plan around mid-range SOC for critical tasks
After months in storage, SOC seems high but drops quickly when used Self-discharge and standby drain not fully tracked Top up the battery and avoid long storage without checking SOC
Runtime at 50% is much shorter in winter Reduced capacity and lower voltage in cold temperatures Warm the unit to near room temperature before heavy use
How common SOC drift symptoms map to likely causes and simple actions. Example values for illustration.

Common Mistakes and Troubleshooting SOC Drift

Most SOC issues are not hardware failures. They are the result of normal estimation limits combined with how the power station is used. Recognizing common mistakes can help you troubleshoot drift before assuming the battery is faulty.

Mistake 1: Treating SOC as Perfectly Linear

Expecting 10% SOC to always equal “exactly one more hour” is unrealistic. Lithium batteries and SOC algorithms are not linear over the full range.

What you might see:

  • 10% lasting a long time under a light load, but only minutes under a heavy load.
  • Middle percentages (30–70%) feeling more predictable than the top or bottom.

What to do: Plan critical loads (medical devices, refrigeration) around generous SOC margins and avoid running them down to the last few percent.

Mistake 2: Never Letting the BMS See Full or Empty

Partial cycling (for example, bouncing between 40% and 80%) is generally gentle on the battery, but if you charge to full or run down near empty, the BMS has fewer clear points to recalibrate its model.

What you might see:

  • Percentage feeling “stuck” or not matching your runtime expectations.
  • SOC jumping a few percent after the unit rests or after a rare deep cycle.

What to do: A few times per year, allow a controlled full charge and a moderate discharge close to empty to give the BMS better reference data.

Mistake 3: Calibrating in Extreme Temperatures

Running a calibration cycle in very cold or very hot conditions can teach the BMS the wrong lesson about how the battery behaves.

What you might see:

  • SOC that looks more accurate in that extreme condition but less accurate at room temperature.
  • Unexpected early shutdown when conditions change.

What to do: Perform calibration-style cycles near room temperature whenever possible.

Mistake 4: Interpreting Storage Behavior as a Defect

After months in storage, it is normal for SOC to be less accurate. The BMS may not precisely track tiny standby currents or self-discharge.

What you might see:

  • Unit shows a high percentage after long storage but drops quickly when you start using it.
  • Small SOC jumps after the unit rests for a while.

What to do: Before important trips or backup use, top up the battery, run it briefly under load, and recharge. This “wakes up” the SOC estimate and reduces surprises.

When to Suspect a Real Problem

While most SOC drift is normal, certain patterns suggest a hardware or cell issue:

  • Very sudden capacity loss (for example, runtime cut in half over a few cycles).
  • Unit shutting down at high SOC under very light loads at room temperature.
  • Unusual heat, swelling, or odors from the battery area.

If you notice these, stop using the power station and follow the manufacturer’s safety and support guidance.

Battery and SOC Safety Basics

SOC drift itself is not a safety hazard; it is a measurement issue. However, understanding SOC and respecting the limits of the BMS helps you use the battery safely and avoid conditions that stress the cells.

Why the BMS Enforces Cutoffs

The BMS is designed to protect the battery and you. It enforces limits that may feel conservative from a user standpoint:

  • Low-voltage cutoff to prevent deep discharge that can damage cells.
  • High-voltage cutoff to prevent overcharge and internal heating.
  • Temperature limits to avoid charging when too cold or too hot.

These protections are the reason a unit sometimes shuts off “early” or refuses to charge in extreme temperatures. The SOC reading is just the visible part; the BMS decisions are based on actual voltage and temperature, which take priority for safety.

Safe Operating Habits Around SOC

You can support the BMS and keep the battery in its comfort zone by:

  • Avoiding repeated deep discharges to 0% SOC when not necessary.
  • Not forcing the unit to restart immediately after a protective shutdown under heavy load.
  • Letting the power station cool if it feels very warm before charging again.

These habits help slow capacity loss, which in turn keeps SOC estimates closer to reality over time.

Signs You Should Stop and Reassess

Independent of SOC accuracy, certain warning signs should not be ignored:

  • Visible swelling or deformation of the battery area.
  • Persistent strong odor, smoke, or crackling sounds.
  • Repeated thermal shutdowns or error codes related to temperature.

In these cases, discontinue use, move the unit to a nonflammable area if it is safe to do so, and follow the manufacturer’s instructions for inspection or replacement.

Long-Term Use, Storage, and Keeping SOC Reasonably Accurate

Over years of use, both the battery and its SOC estimation gradually change. You cannot stop aging, but you can slow it down and keep SOC drift manageable with a few long-term habits.

How Aging Affects SOC

As the battery ages, its total usable capacity decreases. The BMS may adapt to this slowly, but there will always be some lag. This is why a five-year-old power station can still show 100% SOC yet deliver noticeably shorter runtime than when it was new.

In other words, SOC can still be percentage-accurate while the absolute energy behind that percentage has shrunk.

Storage Practices That Support SOC Accuracy

For storage periods measured in weeks or months:

  • Store at a moderate SOC, often around 30–60%, if the manufacturer allows it.
  • Keep the unit in a cool, dry place away from direct sun and freezing temperatures.
  • Every few months, power it on, check SOC, and top up if needed.

Long-term storage at 100% or near 0% increases stress on the battery, accelerates capacity loss, and makes SOC estimation harder because the “true” capacity keeps changing faster.

Using Calibration Sparingly but Intentionally

Running a full calibration-style cycle too often can add unnecessary wear, but never doing it can allow drift to grow. A balanced approach is:

  • Use normal partial cycles most of the time.
  • Perform a controlled full charge and moderate discharge a few times per year, especially if you notice SOC behaving oddly.
  • Avoid doing this at very high or very low temperatures.

This keeps the BMS’s internal model up to date without adding a large number of deep cycles just for calibration.

Practical Takeaways and Specs to Look For

State of charge on a portable power station will never be perfect, but it can be predictable enough for real-world planning. If you understand SOC drift and battery calibration, you can treat the percentage as a helpful guide instead of a hard promise.

In everyday use, the most reliable approach is to:

  • Expect SOC to be most accurate in the middle of the range (roughly 20–80%).
  • Leave a buffer instead of planning to run critical loads down to 0%.
  • Use occasional calibration-style cycles to help the BMS stay aligned with reality.
  • Operate and store the power station in temperature ranges that are comfortable for you, whenever possible.

Specs to Look For When Comparing Power Stations

If you are evaluating or upgrading a portable power station with SOC accuracy in mind, pay attention to more than just capacity and price. Certain specifications and design details affect how trustworthy the battery percentage will feel in daily use.

  • Battery chemistry: LiFePO4 usually offers longer cycle life and more stable performance over time, which helps SOC stay meaningful as the unit ages.
  • Cycle life rating: A higher rated cycle count suggests the battery will hold capacity longer, reducing how quickly SOC and real runtime diverge.
  • Operating temperature range: A wide, clearly stated range for charging and discharging helps you understand when SOC readings are likely to be most reliable.
  • Display detail: Units that show both SOC percentage and estimated remaining time under current load can make drift easier to spot and manage.
  • BMS features: Look for mentions of cell balancing, temperature monitoring, and advanced SOC algorithms or “learning” functions.
  • Idle consumption: Lower standby and inverter idle draw reduce self-discharge effects, which helps SOC remain closer to reality during storage.
  • Clear user guidance: Manuals that describe recommended calibration cycles, storage SOC, and temperature limits give you practical tools to manage drift.

By combining these specifications with good usage habits, you can get predictable, safe performance from your portable power station even as the battery slowly ages and its true capacity changes.

Frequently asked questions

What specifications and features most affect the accuracy of SOC estimates on a portable power station?

Battery chemistry, cycle life rating, BMS features (cell balancing, temperature monitoring, advanced SOC algorithms), operating temperature range, and display detail are key factors. Lower idle consumption also helps SOC stay accurate during storage by reducing untracked self-discharge.

How often should I run a calibration-style cycle to reduce SOC drift?

A balanced schedule is a few controlled calibration-style cycles per year or whenever you notice SOC behaving oddly. Avoid frequent deep cycles for calibration and do them near room temperature to give the BMS reliable top and bottom reference points.

Why does my power station sometimes shut off even though the display shows some percentage left?

The BMS can cut power when pack voltage falls below the safe cutoff under load, even if the SOC estimate still shows remaining percentage. Voltage sag from heavy loads, reduced usable capacity from aging or cold, and SOC overestimation near empty are common reasons for this behavior.

Can temperature changes make SOC readings unreliable?

Yes. Cold temperatures lower voltage and available capacity, making the battery appear emptier, while heat can raise voltage but speed aging. Perform calibration cycles and heavy-use checks near room temperature when possible to avoid teaching the BMS behavior that only applies in extremes.

Is it a mistake to treat SOC as a perfectly linear fuel gauge?

Yes, treating SOC as perfectly linear is a common mistake. SOC is an estimate influenced by load, temperature, and aging, so plan critical loads with a buffer rather than relying on exact percentage-to-runtime conversions.

Does SOC drift pose a safety risk?

SOC drift itself is a measurement issue and not typically dangerous, but it can mask true remaining capacity. More serious safety signs include swelling, persistent odors, smoke, excessive heat, or repeated thermal shutdowns; if you see those, stop using the unit and follow safety guidance.

Battery Management System (BMS) Explained: Protections Inside a Power Station

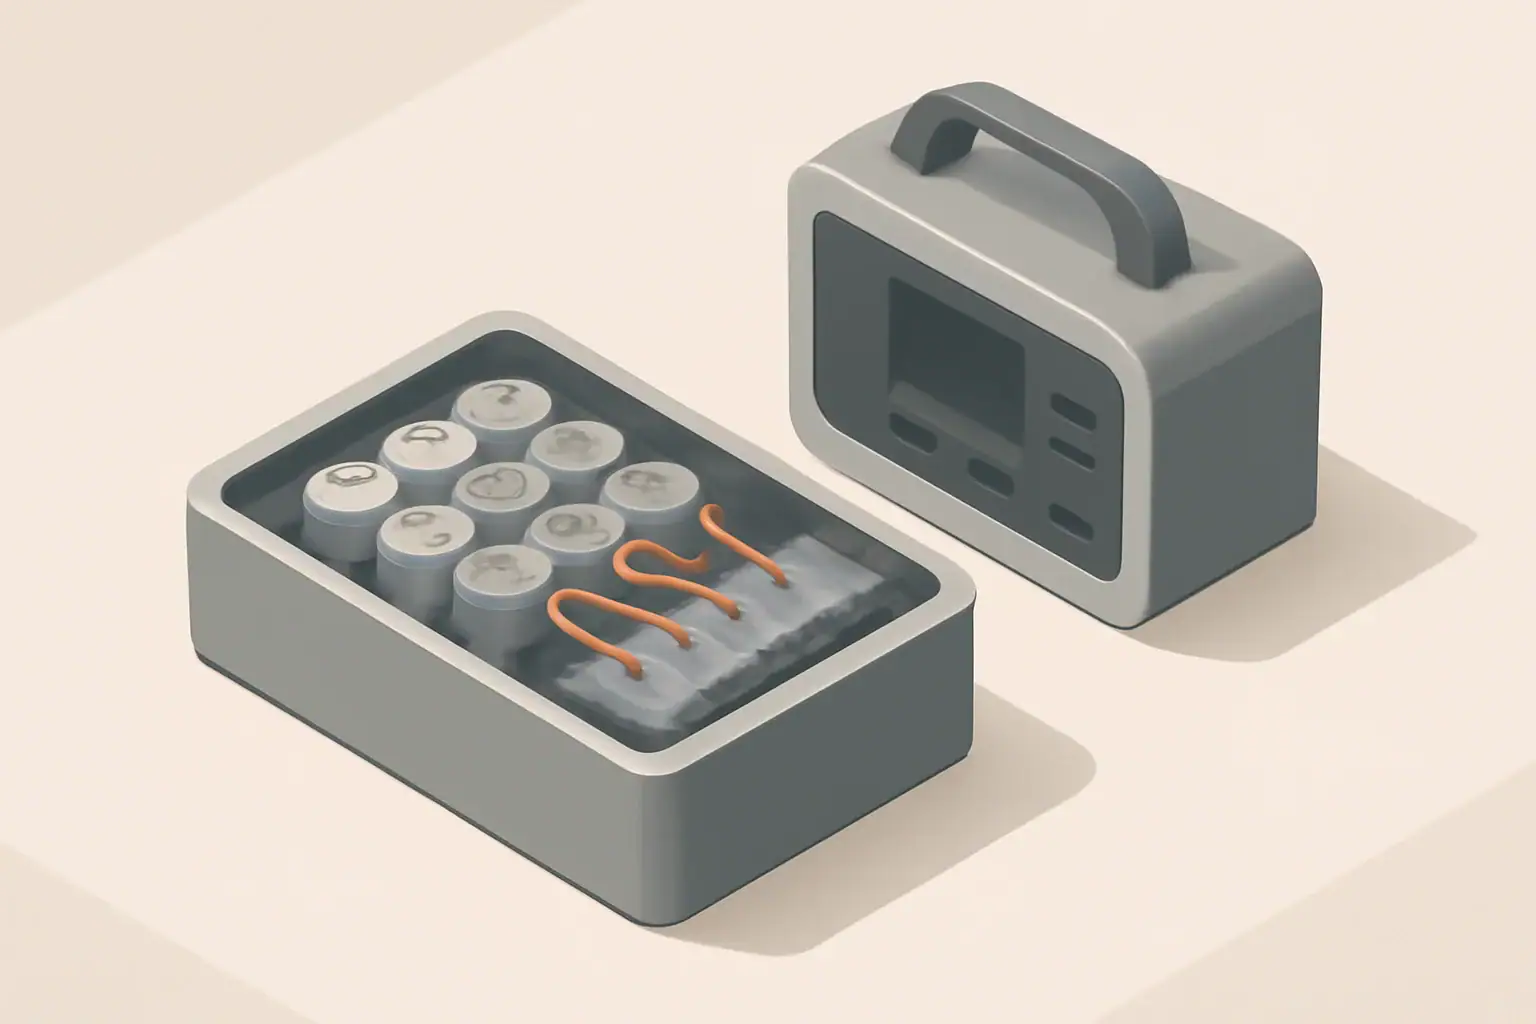
Isometric illustration of battery cells inside module

A battery management system (BMS) is the safety and control brain that keeps a battery pack in a portable power station from being overcharged, over‑discharged, overheated, or pushed beyond its limits. In plain English, the BMS constantly watches the cells and disconnects or limits power before something unsafe or damaging can happen.

Any modern portable power station, solar generator, or lithium battery pack relies on its BMS to manage voltage, current, temperature, and state of charge. The BMS decides when charging must stop, when the inverter is allowed to run, and when the unit needs to shut down to protect itself. Understanding what the BMS does helps you interpret error codes, choose safer products, and avoid habits that shorten battery life.

This guide walks through how a battery management system works, the protections it provides, real‑world examples of BMS behavior, common mistakes that trigger faults, and the key specs to look for when comparing portable power stations.

What a Battery Management System Is and Why It Matters

A battery management system is an electronic control unit that monitors and manages all the cells inside a battery pack. In a portable power station, the BMS sits between the battery cells and the rest of the system (charger, inverter, DC outputs) and enforces safe operating limits.

At a high level, a BMS is responsible for three things:

  • Protection: Preventing unsafe conditions such as overcharge, overdischarge, overcurrent, short circuit, and overtemperature.
  • Optimization: Balancing cells, managing charge and discharge rates, and maximizing usable capacity and cycle life.
  • Information: Estimating state of charge (battery percent), state of health, and reporting faults or warnings to the display or app.

Without a functioning BMS, a portable power station would be at much higher risk of permanent cell damage, rapid capacity loss, or in extreme cases, thermal events. Even if nothing dramatic happens, a weak or poorly tuned BMS can lead to annoying behavior: early shutdowns, inaccurate battery percentage readings, or outputs that turn off unexpectedly under load.

Because the BMS is so central to safety and usability, it is one of the most important—but least visible—parts of any portable power product.

Key BMS Functions and How They Work

Inside a portable power station, the BMS is a combination of sensors, power electronics, and firmware. Together, they monitor the pack and make rapid decisions about when to allow or block current flow.

Core functions typically include:

  • Cell voltage monitoring: Measuring individual cell or cell‑group voltages to enforce upper and lower limits.
  • Current measurement: Using shunts or Hall‑effect sensors to track charge and discharge current in real time.
  • Temperature sensing: Placing sensors near the cells and critical components to watch for overheating or very low temperatures.
  • Switching and isolation: Using MOSFETs, contactors, or relays to connect or disconnect the battery from the rest of the system.
  • Cell balancing: Equalizing cell voltages to keep all cells at similar state of charge.
  • State estimation: Calculating state of charge and state of health based on voltage, current, time, and internal models.

The BMS firmware continuously compares sensor readings to configured limits. When a limit is approached or exceeded, it takes action: reducing charge current, limiting output power, or fully opening the main switches to isolate the pack.

BMS Function What It Monitors Typical Action Taken
Overcharge protection High cell voltage near the top of the charge range Stops charging, may limit current before cutoff
Overdischarge protection Low cell voltage near the bottom of the safe range Shuts down outputs to prevent further discharge
Overcurrent / short circuit protection Rapid current spikes or sustained high current Disconnects the pack using MOSFETs or contactors
Thermal protection Cell and electronics temperature Reduces power, blocks charge, or shuts down system
Cell balancing Differences between cell voltages Bleeds or redistributes energy to equalize cells
State of charge estimation Voltage, current, and time history Updates battery percent display and power limits
Summary of key BMS functions and how they respond to changing battery conditions. Example values for illustration.

How the BMS Coordinates with Charger and Inverter

The BMS does not work in isolation; it constantly exchanges information with the charger and inverter circuits inside the power station. Typical interactions include:

  • Enabling or disabling charging based on cell voltages and temperature.
  • Reducing allowable charge current when the pack is cold, hot, or imbalanced.
  • Allowing the inverter to start only if state of charge and temperatures are within safe limits.
  • Requesting a power limit when the battery is nearly full or nearly empty to avoid stress.

From the user’s point of view, this coordination shows up as behavior like “fast charging until 80%, then slowing down,” or “AC output not available when the battery is too cold.” Those decisions are usually driven by the BMS.

Real‑World BMS Behavior in Portable Power Stations

Seeing how a BMS behaves in everyday situations makes its role easier to understand. The examples below assume a lithium‑ion or lithium iron phosphate pack inside a typical portable power station.

Example 1: Charging in Hot Weather

You leave a power station in a parked vehicle on a sunny day and then plug it into AC to recharge. Inside the case, the pack is already warm. As charging starts, the BMS notices temperature rising toward its upper limit. It may respond by:

  • Reducing charge current so the pack warms more slowly.
  • Activating internal fans to move air across the cells and electronics.
  • Pausing charging entirely until the temperature drops below a safe threshold.

On the display, you might see slower charging than usual or a temperature warning. The BMS is trading speed for safety and long‑term cell health.

Example 2: Running a High‑Surge Appliance

You connect a device with a large startup surge, such as a power tool or small compressor. At the moment of startup, current spikes well above the continuous rating. The BMS measures this spike and decides whether it is acceptable:

  • If the surge is brief and within the configured limit, the BMS allows it and the tool starts normally.
  • If the surge exceeds the limit or lasts too long, the BMS disconnects the battery to protect the cells and switching devices.

From the user’s perspective, this may look like the AC outlet turning off suddenly or an overload icon appearing. Resetting usually involves turning the unit off and back on after the load is removed.

Example 3: Deep Discharge During an Outage

During a power outage, you run lights, a router, and a small fridge from the station. As the battery drains, cell voltages approach the lower cutoff threshold. To prevent overdischarge, the BMS will:

  • Show a low state of charge and may reduce the maximum output power.
  • Shut down AC and DC outputs once the minimum safe voltage is reached.
  • Refuse to turn back on until the pack has been recharged above a recovery threshold.

This can feel like “sudden” shutdown even though the battery indicator still showed some percentage. In many designs, the BMS reserves a small amount of capacity below 0% to protect the cells.

Example 4: Cell Balancing Over Time

After many cycles, individual cells inside the pack drift slightly in voltage. The BMS monitors this imbalance and, usually near the top of charge, activates balancing circuits. In a passive balancing system, small resistors bleed a little energy from the highest‑voltage cells, allowing the lower ones to catch up.

As a user, you might notice that the last few percent of charging takes longer, or that fans run even though the pack is nearly full. That extra time is often the BMS balancing cells to preserve capacity and reduce stress on weaker cells.

Scenario What the User Sees Likely BMS Action
Hot charging environment Slow charging, fan noise, temperature icon Limits charge current or pauses charging to control temperature
High‑surge tool on AC AC output shuts off at startup Detects overcurrent spike and opens main switches
Battery drains to 0% Unit shuts down and will not restart on load Overdischarge protection triggered; requires recharge
Long time at 100% charge Fans or subtle activity even when “full” Performs cell balancing and fine‑tunes state of charge
Very cold weather use Charging disabled, reduced output power Applies low‑temperature charge and discharge limits
Typical user‑visible symptoms and the underlying BMS behavior that causes them. Example values for illustration.

Common Mistakes and Basic Troubleshooting

Many BMS‑related “problems” are actually the system doing its job. Recognizing common patterns can help you respond correctly and avoid unnecessary stress on the battery.

Mistake 1: Treating Repeated Shutdowns as a Simple Glitch

Repeated shutdowns under load are often early warnings, not random errors. Common causes include:

  • Connecting loads that exceed the continuous or surge rating.
  • Blocked ventilation leading to high internal temperatures.
  • Aging cells that cause cell voltage to sag under load, triggering low‑voltage cutout.

Quick check: Try a smaller load, move the unit to a cooler, well‑ventilated area, and fully recharge. If shutdowns continue with modest loads, the pack may need professional evaluation.

Mistake 2: Ignoring Error Icons or Fault Codes

Many power stations display icons or codes for overtemperature, overload, or battery faults. Ignoring these can accelerate wear or mask a developing issue. If a specific code appears repeatedly, note when it happens (during charging, discharging, or storage) and adjust usage accordingly.

Mistake 3: Assuming the BMS Will Recover from Any Deep Discharge

Leaving a power station at 0% for weeks or months can push cells below the BMS’s recovery threshold. In some cases, the BMS will not allow charging at all to avoid charging severely overdischarged cells.

Quick check: If the unit will not turn on or accept charge after long storage, it may be below the safe voltage window. Some designs can be recovered by a controlled low‑current charge, but this is typically a job for trained technicians.

Mistake 4: Using the Wrong Charging Profile

While the BMS provides protection, it cannot fully compensate for an incorrect or incompatible charging source. Feeding the pack with voltages or currents outside its intended range can cause frequent cutoffs, overheating, or long‑term damage.

Quick check: Match the charger type, voltage, and maximum current to the power station’s stated input specifications. If the BMS repeatedly stops charging, verify that the source is within those limits.

Mistake 5: Blocking Cooling Paths

Covering vents or placing the unit in a tight compartment prevents heat from escaping. The BMS will respond by throttling power or shutting down more often, especially under high loads or fast charging.

Quick check: Ensure several inches of clearance around vents and avoid stacking items on top of the power station during operation.

Safety Basics: What the BMS Can and Cannot Do

A well‑designed battery management system significantly improves safety, but it is not a complete guarantee. Understanding its limits helps you use a portable power station responsibly.

What the BMS Does for Safety

  • Prevents common electrical abuse: Cuts off charge or discharge when voltage, current, or temperature exceed safe thresholds.
  • Reduces fire risk under normal use: Limits conditions that can lead to thermal runaway, such as severe overcharge or sustained overcurrent.
  • Provides multiple layers of protection: Combines electronic switching with fuses or thermal cutoffs as a final safety backstop.

What the BMS Cannot Prevent

  • Mechanical damage: Crushing, puncturing, or bending the pack can cause internal shorts that bypass electronic controls.
  • Severe external heat: Exposure to fire, direct flame, or extreme ambient temperatures can damage cells regardless of BMS logic.
  • All manufacturing defects: The BMS can reduce risk but cannot fully eliminate problems from defective cells or assembly issues.

Practical Safety Habits

  • Operate and charge the power station within the specified temperature range.
  • Do not use or charge a unit that has been dropped hard, crushed, or visibly damaged.
  • Avoid covering the unit with blankets, clothing, or other insulating materials while in use.
  • Do not attempt to bypass or modify the BMS, even if it seems overly conservative.
  • Store and transport the power station in a way that prevents sharp impacts and punctures.

Maintenance and Long‑Term Use

The BMS handles day‑to‑day protection, but user habits strongly influence how long the battery remains healthy. A few simple practices can extend cycle life and keep BMS protections from triggering unnecessarily.

Charging and Storage Practices

  • Avoid extremes of state of charge during long storage: For multi‑month storage, many packs age more slowly when stored around a moderate state of charge rather than at 0% or 100%.
  • Keep within recommended temperature ranges: Store and use the power station in cool, dry locations whenever possible.
  • Allow rest after heavy use: After discharging at high power, let the unit cool before starting a full recharge.

Monitoring BMS Behavior Over Time

  • Pay attention to changes in when the unit shuts down under similar loads; earlier shutdowns can indicate aging cells or increased internal resistance.
  • Note any new or persistent fault codes and under what conditions they appear.
  • Check that fans still operate and that vents remain free of dust and debris.

When to Seek Service

  • The unit will not charge or power on after being stored within recommended conditions.
  • Overcurrent, overtemperature, or cell imbalance warnings appear frequently with modest loads.
  • You notice swelling, unusual odors, or localized hot spots on the case.

In these cases, further use without inspection can increase risk. A trained technician can evaluate both the cells and the BMS electronics to determine whether repair or replacement is appropriate.

Practical Takeaways and BMS Specs to Look For

When you understand what a battery management system does, you can better interpret how a portable power station behaves and make more informed buying decisions. The BMS is not just a safety feature; it shapes performance, lifespan, and day‑to‑day reliability.

Product spec sheets and manuals often include details that hint at the quality and capabilities of the BMS. When comparing portable power stations, look for information such as:

  • Cell chemistry and voltage limits: Confirm that charge and discharge voltage ranges are appropriate for the stated chemistry (for example, lithium‑ion or lithium iron phosphate).
  • Continuous and surge power ratings: Check that the BMS and inverter can handle your typical loads plus startup surges.
  • Operating temperature ranges: Note separate ranges for charging and discharging; good BMS designs enforce conservative limits.
  • Overcurrent and short‑circuit protection: Look for explicit mention of electronic protection and fuses rather than relying on fuses alone.
  • Cell balancing method: Passive balancing is common for smaller packs; active balancing can improve efficiency in larger systems.
  • Protections listed: Overcharge, overdischarge, overcurrent, short‑circuit, and overtemperature protections should all be clearly indicated.
  • Cycle life expectations: Higher cycle life claims usually rely on a BMS that limits stress and enforces conservative limits.
  • Diagnostic information: A display or app that shows cell voltages, temperatures, and error codes can make troubleshooting easier.

By focusing on these BMS‑related details, you can choose portable power stations that are not only powerful on paper but also safer, more predictable, and more durable in everyday use.

Frequently asked questions

Which specifications and features matter most when evaluating a battery management system for a portable power station?

Key specs include the supported cell chemistry and voltage limits, continuous and surge power ratings, operating temperature ranges, and the types of overcurrent and short‑circuit protections implemented. Also look for information on cell balancing method and available diagnostics (per‑cell voltages, error codes) since those affect long‑term reliability and troubleshooting.

How can I prevent repeated shutdowns of my portable power station under load?

Repeated shutdowns are often the BMS protecting the pack from overcurrent, thermal stress, or voltage sag caused by aging cells. Reduce peak loads, improve ventilation, and fully charge the unit; if shutdowns persist with modest loads, have the battery and BMS inspected by a technician.

How much safety protection does a BMS actually provide for a portable power station?

A BMS significantly reduces risk by enforcing voltage, current, and temperature limits and isolating the pack during detected faults, often combined with fuses or thermal cutoffs for redundancy. It is not a complete guarantee—mechanical damage, manufacturing defects, or external fires can still cause dangerous failures despite BMS protections.

Can I reset or recover a unit if the BMS has locked out charging after deep discharge?

Some units include recovery thresholds and can be revived after a short controlled charge, but severely overdischarged packs may require a low‑current recovery performed by a trained technician. Avoid bypassing the BMS to force charge, as that can be unsafe and cause additional damage.

Will using the wrong charger harm the BMS or the battery?

Using a charger with incompatible voltage or excessive current can trigger repeated BMS cutoffs, produce excessive heat, and accelerate battery degradation; in extreme cases it can lead to protective shutdowns or damage. Always match the charger voltage, current limit, and profile to the power station’s stated input specifications.

How can I tell whether a problem is caused by the BMS or by the battery cells themselves?

Check fault codes or diagnostic readouts first: communication or sensor errors often point to BMS or electronics faults, while persistent voltage sag, imbalance between cells, or physical swelling indicates cell aging or damage. If diagnostics are unclear or problems continue, seek professional inspection rather than attempting internal repairs.

Battery Cycle Life Explained: What “Cycles” Really Mean

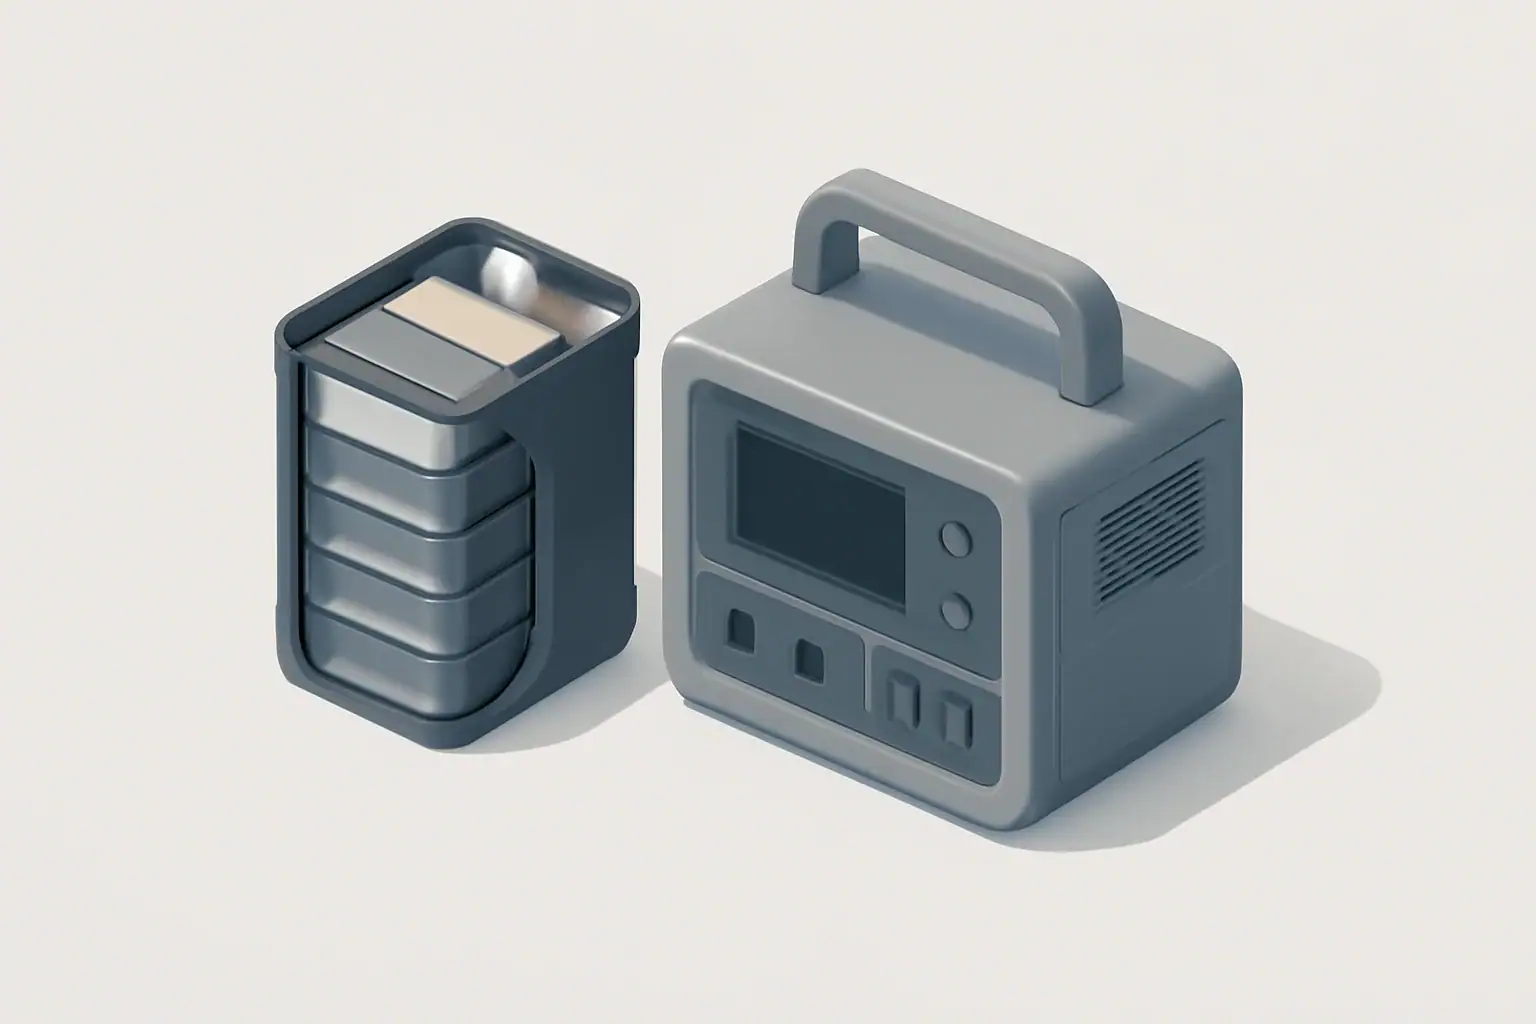
isometric illustration of battery cells inside portable power station

Battery cycle life is the number of times a battery can be charged and discharged before its capacity noticeably drops, usually to around 70–80% of its original energy. In portable power stations, cycle life tells you how long the battery will stay useful for camping, backup power, or off-grid use.

When you see specs like “3,000 cycles to 80%,” that rating combines how many charge–discharge cycles the battery can handle and how much capacity it will have left at the end of that test. Understanding battery cycles, depth of discharge, and calendar aging helps you estimate real-world lifespan, compare different chemistries, and avoid habits that wear batteries out early.

This guide breaks down battery cycle life in plain English, with concrete examples, simple calculations, and practical tips so you can size a portable power station correctly, treat the battery well, and know what to expect over years of use.

What Battery Cycle Life Really Means (and Why It Matters)

Battery cycle life is a measure of how many times a battery can deliver its rated capacity and then be recharged before it loses a defined portion of its original energy storage. For most portable power stations, that “end of life” point is when the battery can only hold about 70–80% of what it could when new.

Key points about battery cycle life for portable power stations:

  • A “cycle” is energy moved (for example, 100% of rated capacity used and recharged), not how many times you press the power button.
  • Capacity fades gradually—the unit does not suddenly die at its rated cycle count.
  • Cycle life ratings are lab numbers based on controlled temperature, depth of discharge, and charge rates.

Why this matters when you buy a power station:

  • If you use it daily, cycle life largely determines how many years you get before runtimes shrink noticeably.
  • If you use it occasionally (for outages or trips), cycle life still matters, but calendar life and storage habits can matter even more.
  • Different battery chemistries (such as LiFePO4 versus other lithium-ion types) trade off weight, cost, and cycle life.

Key Concepts Behind Battery Cycle Life

To interpret cycle life specs correctly, it helps to understand how cycles are counted and what conditions manufacturers assume during testing.

What Counts as a Battery Cycle?

A battery cycle is the equivalent of using 100% of the battery’s rated capacity and then recharging it. This does not require a single full discharge from 100% to 0%.

  • Use 30% of the battery one evening, recharge.
  • Use 40% the next day, recharge.
  • Use another 30% later in the week, recharge.

Together, those add up to roughly one full cycle (30% + 40% + 30% = 100% of rated capacity).

Depth of Discharge (DoD)

Depth of discharge (DoD) describes how much of the battery’s capacity you use in a cycle.

  • 100% DoD: 100% down to near 0%.
  • 50% DoD: 100% down to 50%.
  • 20% DoD: 80% down to 60%, and so on.

In general, the shallower the DoD, the more cycles the battery can provide over its life. Many lab ratings assume a specific DoD (often 80–100%).

End-of-Life Capacity Threshold

Cycle life is almost always paired with an end-of-life capacity threshold, such as:

  • 80% of original capacity (very common for portable power stations).
  • 70% or 60% in some technical data sheets.

If a 1,000 Wh battery is rated for 2,000 cycles to 80%, that means that after roughly 2,000 lab cycles, it is expected to store about 800 Wh. It may still operate for many more cycles, just with shorter runtimes.

Battery Chemistry and Typical Cycle Life

Most portable power stations use one of two broad lithium-based chemistries:

  • Higher-energy-density lithium-ion (such as NMC-type chemistries): lighter and more compact, typically rated for hundreds to around a thousand cycles to 80% under standard test conditions.
  • Lithium iron phosphate (LiFePO4): heavier for the same capacity, but often rated for thousands of cycles to 80% under similar conditions.

Actual numbers depend on cell quality, design, and how conservative the manufacturer is with its ratings.

Standard Test Conditions vs Real Use

Cycle life ratings are generated in controlled tests, typically with:

  • Temperature around 25°C / 77°F.
  • Fixed charge and discharge currents (C-rates).
  • Repeated cycles at a specified DoD.

Real use is messier: temperature swings, irregular loads, fast charging, and occasional deep discharges. These differences are why a battery might last longer or shorter than the spec suggests.

Battery type Typical lab rating format Approximate use case fit
Higher-energy-density lithium-ion 500–1,000 cycles to 80% at 80–100% DoD Lighter, more portable units; occasional or moderate use
Lithium iron phosphate (LiFePO4) 2,000–6,000+ cycles to 80% at 80–100% DoD Heavier units; frequent or daily cycling, off-grid living
Typical cycle life rating patterns for common portable power station battery chemistries. Example values for illustration.

Real-World Battery Cycle Life Examples

Once you understand how cycles work, you can translate lab ratings into everyday usage patterns and expected years of service.

Example: Daily vs Occasional Use

Consider a 1,000 Wh portable power station rated for 3,000 cycles to 80% capacity:

  • Daily user (about one full cycle per day): 3,000 cycles ≈ 8–9 years before the battery drops to around 80% of its original capacity under similar conditions.
  • Weekend user (one cycle per week): 3,000 cycles is far beyond any realistic time frame; in practice, calendar aging (years on the shelf) will limit life first.

Now compare that to a unit rated for 800 cycles to 80% used every day:

  • 800 cycles ≈ a little over 2 years of daily full cycling before reaching about 80% capacity in lab-like conditions.

Example: Multiple Small Discharges per Day

Imagine a 1,000 Wh portable power station used for home backup:

  • Morning: 150 Wh for a coffee maker and lights.
  • Afternoon: 250 Wh for a laptop and router.
  • Evening: 200 Wh for lighting and a fan.

Total for the day: 600 Wh. If you recharge to 100% afterward, that day counts as about 0.6 of a cycle. After two similar days, the battery management system will have logged roughly 1.2 cycles.

Example: Depth of Discharge and Years of Life

Using shallower cycles can significantly extend effective cycle life. Suppose you have a 1,200 Wh power station and you use about 300 Wh per day.

  • Daily DoD ≈ 25% (300 Wh / 1,200 Wh).
  • Effective stress per cycle is lower than cycling 80–100% of capacity daily.

While the spec might say “2,000 cycles to 80% at 80% DoD,” your 25% DoD use pattern can reasonably lead to many more calendar years before you notice a similar drop in capacity, assuming moderate temperatures and charge rates.

Example: Sizing for Shallow Cycling

Assume you regularly need about 500 Wh per day:

  • 600 Wh unit: ≈ 83% DoD per day.
  • 1,000 Wh unit: ≈ 50% DoD per day.

The larger unit costs more and weighs more, but the lower daily DoD generally means less wear per cycle and a longer useful lifespan for the battery.

Scenario Battery capacity Typical daily use Approx. DoD per day What this means for cycle life
Small unit pushed hard 600 Wh 500 Wh ≈ 83% Fewer total cycles; faster capacity loss if used daily
Larger unit, same load 1,000 Wh 500 Wh ≈ 50% Less stress per cycle; more total cycles over life
Large unit, light use 1,200 Wh 300 Wh ≈ 25% Very shallow cycling; cycle aging is slow, calendar aging dominates
How battery size and daily energy use affect depth of discharge and effective cycle life. Example values for illustration.

Common Mistakes That Shorten Cycle Life (and What to Watch For)

Certain habits and conditions can significantly reduce the real-world cycle life of a portable power station. Recognizing these early can help you troubleshoot capacity loss and adjust your usage.

Frequent Very Deep Discharges

Regularly running the battery down to near 0% state of charge (SoC) increases stress on the cells.

  • What you might notice: The unit cuts off more quickly under load; the percentage drops rapidly near the bottom.
  • Better approach: Aim to keep most cycles between roughly 10–90% or 20–80% when practical, especially for daily use.

Storing at 100% in Hot Conditions

Leaving a power station fully charged for months in a warm or hot environment accelerates calendar aging.

  • What you might notice: After a year or two of being stored fully charged in a hot garage or vehicle, the battery no longer holds as much energy, even if you rarely used it.
  • Better approach: For long-term storage, keep it in a cool, dry place at a moderate SoC if the manual allows.

Consistently Pushing Maximum Output or Fast Charge

Regularly running near the maximum continuous output or always using the fastest possible charging mode can increase heat and mechanical stress inside the cells.

  • What you might notice: The fan runs often, the case feels warm or hot, and capacity seems to drop faster over time.
  • Better approach: When longevity matters, stay within comfortable continuous loads and use moderate charge rates when time allows.

Ignoring Early Signs of Capacity Loss

All batteries lose capacity, but rapid loss can signal that usage or storage habits are too harsh.

  • Warning cues:
    • Runtime drops sharply within the first year under moderate use.
    • The unit shuts off early under loads it previously handled easily.
    • The percent indicator jumps or behaves erratically, even after full charges.
  • What to try:
    • Review your typical DoD and reduce deep discharges where possible.
    • Avoid hot storage and constant full charge.
    • If the manual recommends it, perform a controlled full discharge and full recharge to help recalibrate the state-of-charge reading (this affects the display more than the actual chemistry).
Common mistake Effect on cycle life Practical fix
Running to 0% on most cycles Increases wear per cycle; fewer total cycles before capacity drops Recharge earlier; aim for shallower cycles when possible
Storing fully charged in a hot space Accelerates calendar aging; capacity loss even without many cycles Store in a cool area at a moderate state of charge for long-term storage
Always using maximum fast charge More heat and stress; can shorten effective cycle life Use standard or eco charging modes when speed is not critical
Leaving the unit unused for months at very low charge Risk of over-discharge and permanent capacity loss Top up periodically; avoid letting SoC sit near empty for long periods
Typical user habits that reduce battery cycle life and simple adjustments to improve longevity. Example values for illustration.

Good safety practices also support better cycle life. While modern portable power stations include protection circuits, user behavior still matters.

Respect Temperature Limits

Most manufacturers specify safe operating and charging temperature ranges.

  • Avoid charging when very cold or very hot. Charging outside the recommended range can increase internal stress and may be blocked by the battery management system.
  • Do not cover ventilation openings. Allow airflow so internal components can shed heat during charging and heavy loads.

Use Approved Charging Methods

Cycle life and safety both depend on appropriate charging.

  • Use only the recommended input voltage and current levels for AC, DC, or solar charging.
  • Avoid improvised wiring or non-matching connectors that could bypass safety controls.

Avoid Physical Damage and Moisture

Mechanical and environmental stress can compromise both safety and longevity.

  • Do not drop, crush, or puncture the unit.
  • Keep it away from standing water, heavy condensation, or corrosive environments.
  • If the case is damaged or swollen, discontinue use and follow local guidance for safe handling and recycling.

Watch for Unusual Behavior

Changes in behavior can be early indicators of a problem.

  • Unusual smells, hissing, or visible smoke.
  • Extreme heat during light loads or charging.
  • Sudden, severe loss of capacity unrelated to normal aging.

If you observe these signs, stop using the device and follow the manufacturer’s safety instructions. While rare, ignoring serious symptoms can be hazardous.

Long-Term Use, Maintenance, and Storage

Even with a high cycle life rating, long-term performance depends heavily on how you store and maintain the battery between uses.

Calendar Life vs Cycle Life

Cycle aging comes from charging and discharging. Calendar aging happens simply as time passes, even if the battery is rarely used.

  • High average SoC, especially at high temperature, accelerates calendar aging.
  • Moderate SoC and cooler storage slow down this process.

For emergency backup power, where cycle count is low, calendar life and storage conditions often matter more than the headline cycle rating.

Storage Best Practices

For storage periods of several weeks or more:

  • Store in a cool, dry place away from direct sunlight.
  • Avoid leaving the unit in a hot vehicle or unventilated shed.
  • If the manual allows, store at a moderate SoC rather than at 0% or 100% for months at a time.

Periodic Top-Ups and Checks

Even when idle, portable power stations can slowly self-discharge and draw a small amount of power for internal electronics.

  • Turn the unit on every few months to check the state of charge.
  • Recharge if the SoC has fallen significantly to avoid deep storage discharge.
  • Run a short test with a familiar load (such as a light or small appliance) to confirm normal behavior.

Balancing Longevity with Convenience

Maximizing cycle life sometimes conflicts with convenience. For example, keeping a unit at 100% all the time is convenient but not ideal for long-term aging. A practical balance is:

  • Keep it charged and ready during seasons when power outages or trips are likely.
  • During long idle periods, shift to moderate SoC storage and periodic top-ups.

Practical Takeaways and Specs to Look For

Once you understand how cycle life works, you can read spec sheets more critically and match a portable power station to your actual use pattern.

Key Takeaways

  • Battery cycle life is about total energy throughput, not how many times you turn the unit on.
  • Shallower cycles, moderate temperatures, and sensible charging habits can significantly extend real-world lifespan.
  • Higher cycle life ratings are especially valuable for daily or heavy use; for rare emergency use, storage habits and calendar life are just as important.
  • Battery chemistry influences both cycle life and weight/size, so consider how often and how you plan to carry and use the unit.

Specs to Look For When Comparing Models

When you compare portable power stations, look beyond the marketing phrases and focus on these cycle-life-related items:

  • Cycle life rating format
    • Look for statements like “X cycles to Y% capacity.”
    • Note both the number of cycles and the end-of-life percentage (for example, 80% vs 70%).
  • Depth of discharge used for testing
    • If provided, note whether the rating is at 80% DoD, 100% DoD, or another value.
    • Be cautious when comparing ratings that use different DoD assumptions.
  • Battery chemistry
    • Higher-energy-density lithium-ion types: lighter and more compact, often fewer cycles.
    • LiFePO4: heavier but often many more rated cycles.
  • Operating and storage temperature ranges
    • Check that the specified temperature ranges fit your climate and intended use (garage storage, vehicle use, outdoor trips).
  • Charging options and limits
    • Look for recommended (not just maximum) charge rates if longevity is a priority.
    • Confirm that your typical charging method (AC, DC, solar) is within the comfortable range.
  • Warranty terms related to the battery
    • Some warranties specify years and may reference expected capacity retention.
    • While not a direct measure of cycle life, stronger battery warranties can signal confidence in long-term performance.

By combining the official cycle life rating with your own expected usage pattern—daily vs occasional, shallow vs deep discharge, hot vs cool environment—you can make a more informed decision about which portable power station will deliver the best long-term value for your situation.

Frequently asked questions

Which battery specs and features matter most when comparing cycle life and long-term value?

Look for a clear cycle life statement (for example, “X cycles to Y% capacity”), the depth-of-discharge used for testing, battery chemistry, recommended charging rates, and operating/storage temperature ranges. Warranty terms that reference battery capacity retention can also be a useful indicator of expected long-term performance. These items together help translate lab ratings into real-world expectations.

Does regularly running a battery to 0% shorten its cycle life?

Yes. Frequent deep discharges increase cell stress and typically reduce the total number of cycles the battery will deliver before capacity declines. When practical, keeping cycles shallower (for example, between 10–90% or 20–80%) will extend effective cycle life.

What high-level safety precautions should I follow when using and charging a portable power station?

Follow the manufacturer’s temperature and charging guidelines, use approved charging methods and rated cables, and avoid mechanical damage or exposure to moisture. Also watch for unusual signs like extreme heat, hissing, or smoke and stop use immediately if they occur. These precautions protect both safety and battery longevity.

How should I store a power station if I won’t use it for several months?

Store the unit in a cool, dry place at a moderate state of charge (not fully charged or fully empty) if the manual permits, and top it up periodically to avoid deep storage discharge. Avoid leaving a fully charged unit in hot environments, as that accelerates calendar aging. Regular checks every few months help prevent unexpected capacity loss.

Can frequent fast charging or running at maximum output reduce cycle life?

Frequent fast charging and sustained maximum output increase heat and mechanical stress inside cells, which can accelerate capacity loss and reduce effective cycle life. If longevity is important, use moderate charge rates and avoid constant maximum loads when possible. Occasional fast charges or heavy draws are generally less harmful than continual use at those extremes.

How do manufacturers test cycle life, and why might real-world results differ?

Manufacturers typically test cycle life under controlled conditions (around 25°C, fixed charge/discharge currents, and a specified DoD) and count cycles until the battery reaches a defined capacity threshold. Real-world use involves temperature swings, varying loads, different DoD patterns, and calendar aging, so actual lifespan can be longer or shorter than lab numbers depending on conditions and habits.