
Why State of Charge on Portable Power Stations Is Not Exact
The battery percentage on a portable power station looks simple: 100% means full, 0% means empty. In reality, that number is an estimate based on internal measurements and calculations. Over time, this estimate can drift, so the state of charge (SOC) reading no longer matches the true amount of energy in the battery.
Understanding why SOC drifts helps explain common questions, such as:
- Why the display might drop from 100% to 90% quickly, then slow down
- Why a unit may shut off even though it still shows 5–10% remaining
- Why the same battery seems to last different amounts of time between charges
This article explains how SOC is estimated in modern lithium-ion and LiFePO4 portable power stations, why readings drift, and what battery calibration really means.
What State of Charge (SOC) Actually Means
State of charge is a way to express how full a battery is relative to its usable capacity.
In basic terms:
- 100% SOC: the battery is at its allowed upper charge limit
- 0% SOC: the battery has reached its allowed lower discharge limit
- 50% SOC: about half of the usable capacity is available
Important details:
- SOC refers to usable capacity, not the absolute chemical limits of the cells.
- Battery management systems (BMS) keep a safety margin at the top and bottom to protect the cells.
- The percentage you see is already shaped by those safety limits and internal assumptions.
SOC vs. State of Health (SOH)
SOC is often confused with state of health (SOH).
- SOC: how full the battery is right now.
- SOH: how much capacity the battery can store compared to when it was new.
As SOH declines with age, 100% SOC can represent less total energy than it did when the battery was new. SOC may still read accurately as a percentage, even though runtime is shorter.
How Portable Power Stations Estimate SOC
Modern portable power stations use a combination of methods to estimate SOC. None of these can measure the exact number of remaining watt-hours directly, so the BMS relies on models and assumptions.
Method 1: Voltage-Based Estimation
The most basic method uses battery voltage. A charged lithium-ion or LiFePO4 battery sits at a higher voltage than a discharged one. The BMS compares the measured voltage to an internal lookup table that maps voltage to SOC.
However, voltage is affected by many factors:
- Load current: high loads cause voltage sag
- Temperature: cold batteries show lower voltage
- Cell chemistry: different chemistries have different voltage curves
- Rest time: voltage recovers after the load is removed
LiFePO4 batteries in particular have a very flat voltage curve over much of their SOC range. That means a small change in voltage may correspond to a large change in SOC, which makes pure voltage-based estimation unreliable.
Method 2: Coulomb Counting (Current Integration)
To improve accuracy, many systems use coulomb counting. The BMS measures current going in and out of the battery and integrates it over time to track the net charge.
Conceptually:
- When charging, the BMS adds amp-hours (Ah) to the internal counter.
- When discharging, it subtracts amp-hours from the counter.
- The counter is referenced to a known full or empty point to express SOC as a percentage.
Coulomb counting works well over short periods, but:
- Measurement errors accumulate over time.
- Actual usable capacity changes with temperature, age, and discharge rate.
- Self-discharge during storage may not be perfectly tracked.
Method 3: Hybrid Algorithms and Battery Models
Most portable power stations use a hybrid approach that combines coulomb counting, voltage measurements, temperature sensing, and predefined battery models.
Typical behavior:
- During active use, SOC follows coulomb counting, adjusted for efficiency losses.
- When the battery rests, the system compares resting voltage to its model and may correct the SOC estimate.
- At well-defined points, such as a controlled full charge or low-voltage shutdown, the BMS sets reference points for 100% or 0% SOC.
These internal models are designed around expected behavior of lithium-ion or LiFePO4 cells, but every real battery deviates slightly from the model. Over many cycles, these deviations cause SOC errors unless the system is periodically recalibrated.
Why SOC and Battery Percentage Drift Over Time
SOC drift is the gradual mismatch between the displayed percentage and the true remaining capacity of the battery. This is normal and expected for all batteries that rely on estimation.
1. Measurement and Rounding Errors Add Up
The BMS measures current, voltage, and temperature at discrete intervals. Each measurement is subject to:
- Sensor accuracy limits
- Rounding inside the microcontroller
- Sampling delays, especially under rapidly changing loads
Over dozens of cycles, even small errors in coulomb counting accumulate, especially if the battery is rarely taken to clear reference points like a full charge.
2. Capacity Changes with Age and Use
As a lithium-ion or LiFePO4 battery ages, its total usable capacity gradually decreases. However, the BMS’s internal model may still assume a higher capacity unless the firmware adapts or is recalibrated.
This leads to issues such as:
- Battery reaching low-voltage cutoff before the display hits 0%
- Unexpectedly short runtime at low SOC
- Power station shutting down earlier than the percentage suggests
3. Temperature Effects
Temperature has a major influence on both voltage and effective capacity:
- Cold temperatures reduce available capacity and lower the voltage curve.
- High temperatures can temporarily increase capacity but accelerate aging.
If the BMS uses temperature-compensated models, it may still not perfectly match the real behavior of the particular cells. SOC estimated at one temperature may not align well when conditions change.
4. Self-Discharge and Storage
When a portable power station sits unused, the battery slowly self-discharges. The BMS itself consumes a small standby current, and connected devices in low-power modes may draw additional energy.
If the system does not fully track these small, continuous currents, SOC may be overestimated after long storage periods. Users may see:
- Display still showing a high percentage after weeks or months
- Rapid drop in SOC once power draw resumes
5. Irregular Charge and Discharge Patterns
Many users operate their power stations in partial cycles: topping up from 40% to 80%, or discharging only from 100% to 60% repeatedly. While this can be gentle on the battery, it provides fewer clear reference points for the SOC algorithm.
Over time, this can cause:
- SOC staying “stuck” around certain ranges
- Percentage suddenly jumping after an unusually deep discharge or full charge
- Mismatch between the displayed percentage and expected runtime from experience
What Battery Calibration Really Means
Battery calibration in the context of portable power stations is about calibrating the SOC estimate, not changing anything inside the cells.
Calibration aligns the BMS’s internal model with the actual behavior of the battery pack by providing clear reference points.
Common Calibration Steps in Practice
Although specific procedures vary, many systems benefit from a periodic controlled cycle:
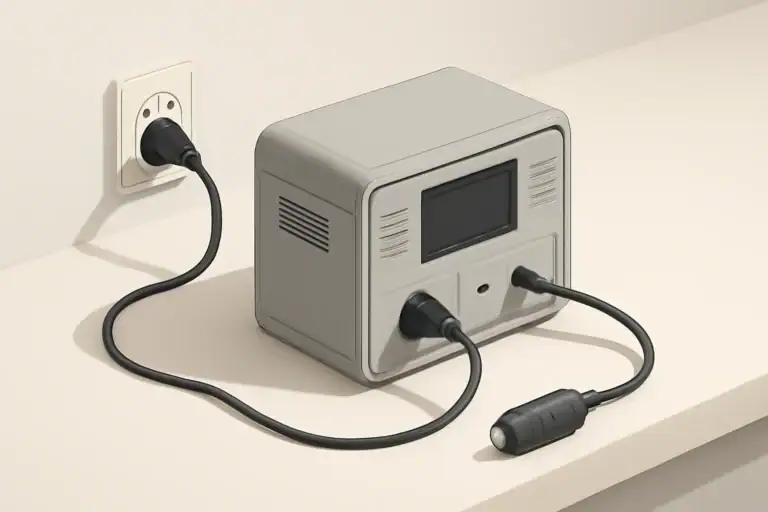
- Charge to 100%
Allow the unit to charge until it reaches a stable full state and remains there for a while (often 1–2 hours after first reaching 100%). This lets the BMS confirm its top-of-charge reference. - Discharge under a moderate load
Use the power station at a moderate, continuous load (not extremely high or extremely low) down to a low SOC level or until it shuts off normally. This helps the BMS observe the full discharge curve. - Recharge fully without interruption
After shutdown, recharge to 100% again in one session if possible. The full cycle gives the BMS data points to adjust its estimates.
Some devices have built-in learning algorithms that automatically refine SOC over time without a deliberate calibration cycle. Others benefit from an intentional recalibration if you notice persistent inaccuracies.
What Calibration Cannot Fix
Calibration cannot:
- Restore lost capacity from aging or heavy use
- Change the battery’s chemistry or safety limits
- Override low-temperature or high-temperature protections
It only improves how well the displayed percentage matches the real usable energy under typical conditions.
How Drift Appears in Everyday Use
SOC drift often shows up as specific behaviors that users notice when running appliances or charging devices from a portable power station.
Nonlinear Percentage Drop
A common observation is that the first 10–20% seems to drop quickly, then the percentage appears to move slowly through the middle, and then may drop quickly again near the bottom.
This nonlinearity comes from:
- The shape of the voltage curve for lithium-ion and LiFePO4 chemistries
- How the SOC algorithm smooths or averages readings
- Different loads at different times (for example, starting a high-wattage appliance briefly)
Even with perfect calibration, SOC will not always decrease at a steady rate because power draw and internal efficiency are not constant.
Early Shutdown with Percentage Remaining
Another common concern is a power station shutting down with 5–15% still showing on the display. This usually indicates that:
- The battery has reached its low-voltage cutoff under the current load.
- Actual capacity is lower than assumed, often from age or temperature.
- The SOC algorithm has drifted and is overestimating remaining energy.
After cooling or resting, the battery’s voltage may recover, and the display might still show a nonzero percentage, even though the BMS will not allow further discharge.
Different Runtime at the Same SOC
Users may notice that 50% SOC sometimes powers a device for several hours, and other times only for a short period. Factors include:
- Load level: high wattage draws reduce effective capacity due to internal resistance and heat.
- Temperature: cold reduces usable capacity, especially for lithium-ion chemistries.
- Recent usage: a heavily loaded battery may experience more voltage sag at the same SOC.
SOC is a snapshot of remaining charge, not a guarantee of runtime. Runtime always depends on power draw and conditions.
Best Practices to Keep SOC Readings Reasonably Accurate
Some drift is inevitable, but you can help your portable power station maintain more reliable SOC estimates through your usage patterns.
Occasionally Run a Full Calibration Cycle
If the manufacturer’s guidance allows it, consider:
- Charging fully to 100% until the charger clearly stops
- Discharging to a low percentage or automatic shutdown with a moderate, steady load
- Recharging to 100% in one uninterrupted session
Doing this a few times per year can give the BMS better data to align its internal model with reality.
Avoid Extreme Temperatures During Critical Measurements
If you want the most reliable reading:
- Charge and discharge near room temperature when possible.
- Avoid calibrating in very cold or very hot environments.
- Let a cold or hot unit rest indoors before relying on the SOC reading.
Store at Moderate SOC and Check Periodically
For storage:
- Many lithium-ion and LiFePO4 batteries prefer storage around 30–60% SOC.
- If left unused for months, expect SOC to be less accurate due to self-discharge and standby loads.
- Periodically power the unit on and top it up if needed.
Long-term storage at 100% or near 0% SOC can increase degradation, which in turn complicates accurate SOC estimation as the battery’s capacity changes.
Understand That SOC Is an Estimate, Not a Fuel Gauge
Unlike a tank of liquid fuel, a battery’s energy content is not directly measurable with a simple sensor. Treat SOC as an educated estimate that:
- Is very helpful for planning
- Will never be mathematically perfect
- Can shift slightly as the BMS refines its model
Key Takeaways for Portable Power Station Users
Portable power stations rely on complex algorithms to display state of charge. Lithium-ion and LiFePO4 batteries change over time with use, temperature, and age, so some drift in SOC is normal.
By recognizing that SOC is an estimate, occasionally allowing full charge and controlled discharge cycles, and operating within reasonable temperatures, you help the battery management system stay better calibrated. This leads to more predictable runtimes and fewer surprises, even as the battery naturally ages and its true capacity gradually declines.
Frequently asked questions
Why does my power station drop from 100% to 90% quickly?
That behavior is usually caused by how the SOC estimate is calculated: initial voltage and coulomb-counting corrections, rounding, and the battery model can make the top percentiles move faster. A brief voltage sag under load or the BMS applying efficiency corrections can make the displayed percentage fall quickly at first and then stabilize.
Why can the unit shut off while the display still shows 5–15% remaining?
The BMS enforces a low-voltage cutoff to protect cells, and under real load the battery can reach that cutoff before the SOC estimate reaches 0%. This can be due to capacity loss from age, temperature-related capacity reduction, or SOC drift that overestimates remaining energy.
How often should I run a calibration cycle to reduce SOC drift?
For most users, performing a full charge→controlled discharge→full recharge cycle a few times per year is sufficient, or whenever you notice persistent inaccuracies. Follow the manufacturer’s guidance and avoid extreme temperatures during calibration for the best results.
Can calibration restore lost battery capacity?
No — calibration only improves the accuracy of the SOC estimate by aligning the BMS model to observed full and empty points. It cannot reverse capacity loss caused by age, cycling, or cell degradation.
Does temperature make SOC readings unreliable?
Yes. Temperature changes affect cell voltage and usable capacity, so SOC estimated at one temperature may not match performance at another. Avoid calibrating in very hot or cold conditions and expect shorter runtimes in cold environments.
Recommended next:
Related guides
Browse this topic →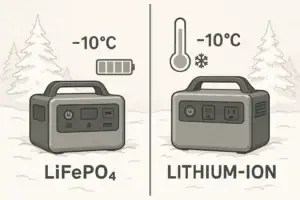


- Beginner-friendly sizing, runtime & specs
- Solar & charging (MPPT, fast charging, cables)
- Batteries (LiFePO4, cycles, care & storage)
- Safety, cold-weather performance, real-world tips
More in Battery
See all →- Depth of Discharge (DoD) Explained: How Partial Cycles Extend Battery Life (LiFePO4 vs NMC)
- BMS Explained: What a Battery Management System Actually Does in a Portable Power Station
- Temperature Limits Explained: Safe Charging/Discharging Ranges and What Happens Outside Them
- Battery Management System (BMS) Explained: Protections Inside a Power Station
- Battery Cycle Life Explained: What “Cycles” Really Mean
Keep reading

About this site
Portable Energy Lab publishes practical, independent guides about portable power—clear sizing, safe use, and real-world expectations.
Affiliate disclosure
Some links on this site may be affiliate links. If you buy through these links, we may earn a small commission at no extra cost to you. This helps support our content. Learn more.