Battery Calibration Explained: When (and How) to Do a Full Discharge Without Damaging the Pack

portable power station with abstract energy blocks in isometric view

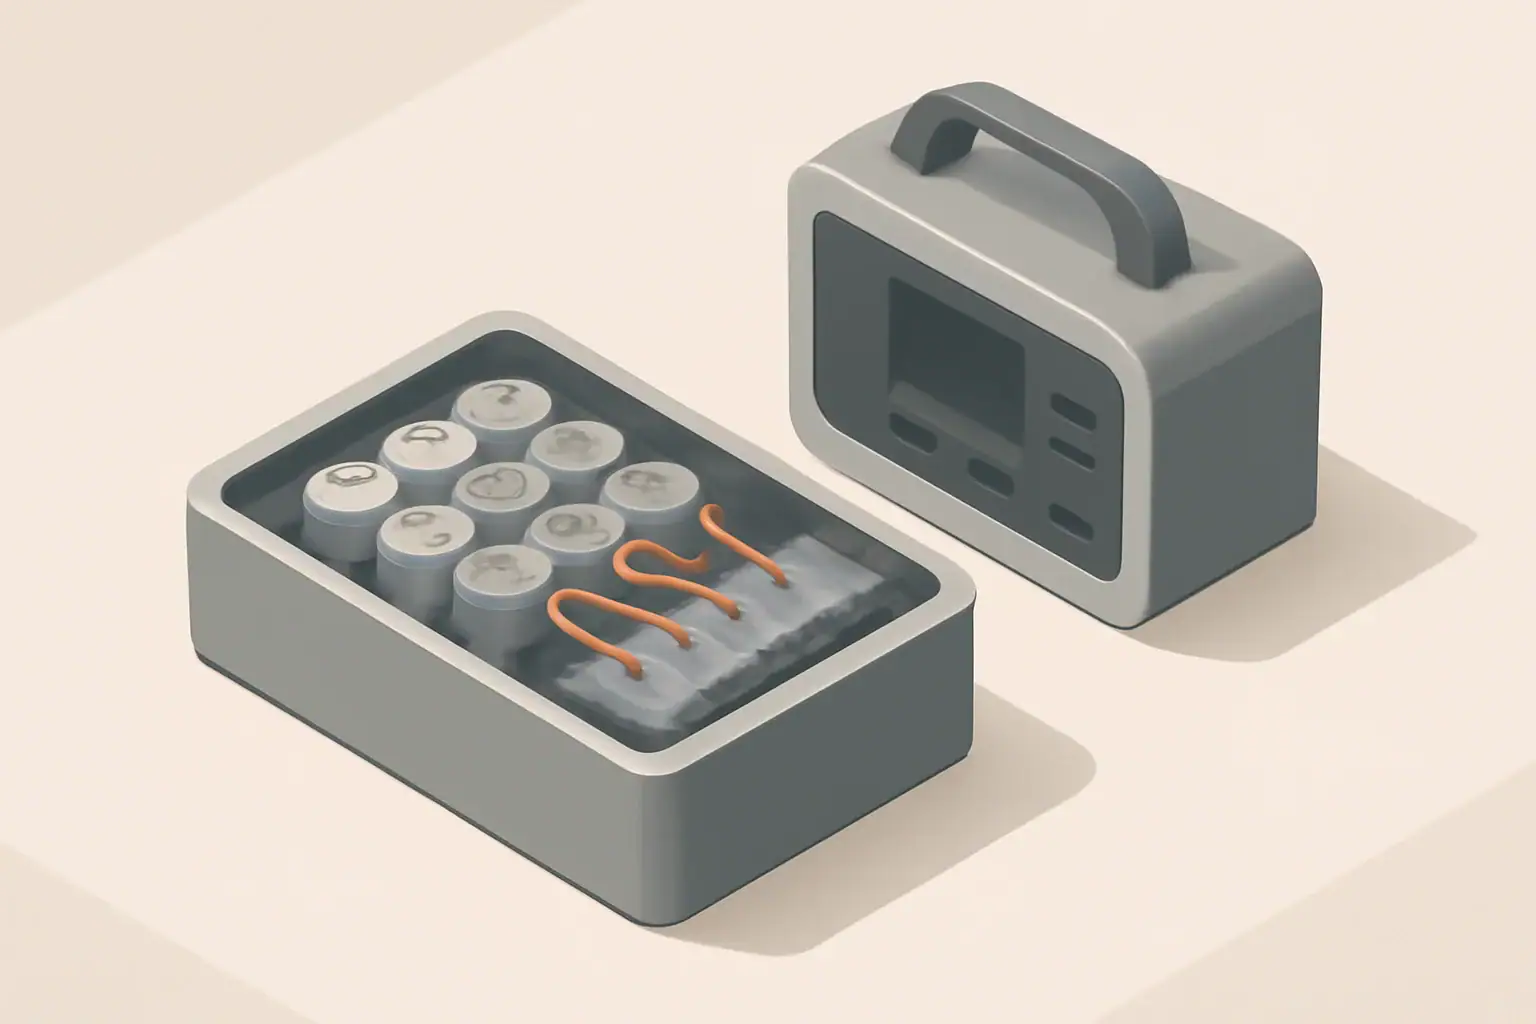
Battery calibration, in the context of portable power stations, is about aligning the internal battery management system with the actual usable capacity of the battery pack. Modern lithium batteries do not need calibration to work, but the electronics that estimate remaining runtime and state of charge can drift over time. Calibration helps the percentage meter and runtime estimates become more accurate again.

When people talk about doing a “full discharge” for calibration, they usually mean running the power station down close to empty and then charging it back to full in a controlled way. This does not create new capacity inside the battery; it simply helps the device learn where “empty” and “full” really are. If done too often or too aggressively, deep discharges can stress the pack, so it is important to understand when it is useful and when it is unnecessary.

For most portable power stations used around the home, for camping, or for remote work, frequent calibration is not required. The internal battery management system is designed to protect the cells and provide safe operating limits. You usually only consider a calibration cycle when the percentage reading or runtime predictions become obviously inaccurate, such as shutting off with 20% still showing or staying at 100% for a very long time before dropping.

Understanding how calibration fits with capacity, power draw, and charging behavior helps you plan realistic runtimes and avoid habits that shorten battery life. Instead of chasing perfect percentage readings, focus on correct sizing, safe operation, and gentle use patterns that preserve the pack over many years.

What Battery Calibration Really Means and Why It Matters

Key Concepts: Capacity, Power, and Why Meters Drift

To make sense of battery calibration and full discharge cycles, it helps to separate power (watts) from energy (watt-hours). Wattage describes how fast you are using energy at any moment, like the speed of water flowing from a hose. Watt-hours describe how much energy is stored in the battery, like the size of the tank. A portable power station with 500 watt-hours of storage can, in theory, run a 100-watt device for about five hours, before considering losses.

Real-world runtimes are always lower than simple math suggests because of inverter and conversion losses. Most portable power stations convert the battery’s DC power to AC for household-style outlets, and that conversion is not perfectly efficient. You might only get 80–90% of the rated watt-hour capacity as usable output, depending on load size, temperature, and how the unit is designed. Calibration does not change these losses; it only helps the meter report them more accurately.

Another key distinction is between running watts and surge watts. Many devices, especially those with motors or compressors, require a short burst of higher power at startup. Your portable power station’s inverter has limits on both continuous power and short surges. If a load exceeds those limits, the power station may shut down even if the battery still has plenty of energy. Users sometimes misinterpret this as a battery problem when it is actually a power (wattage) issue, not capacity.

The state-of-charge meter can drift over time because the system estimates capacity based on current, voltage, and past usage patterns. Small errors accumulate, especially if the power station is often used in partial cycles, stored at high or low temperatures, or rarely allowed to reach full charge. A purposeful, controlled discharge followed by a full charge can give the system clear reference points for “top” and “bottom,” improving the accuracy of the remaining percentage and runtime estimates.

Portable power station sizing and calibration checklist. Example values for illustration.
What to review Why it matters Typical example
Total wattage of planned loads Prevents inverter overload and shutdowns Phone (10 W) + laptop (60 W) + router (10 W) ≈ 80 W
Surge vs running watts of appliances Avoids trips when motors or compressors start Small fridge: 60–100 W running, several times higher surge
Energy (Wh) vs expected hours of use Helps determine if capacity meets your scenario 500 Wh pack powering 100 W for about 4 hours, after losses
Inverter efficiency and conversion losses Explains why real runtime is less than basic math Plan on 10–20% less than rated Wh for AC loads
Observed meter accuracy Signals if a calibration discharge may help Shuts off at 15–25% displayed charge repeatedly
Usage pattern over last few months Frequent small top-offs can increase meter drift Many partial charges, rarely below 50% before recharging
Battery age and cycle count Helps separate normal aging from calibration issues Older unit with many cycles may show reduced runtime

How Calibration Relates to Portable Power Station Sizing

If your power station is undersized for your loads, no amount of calibration will prevent shutdowns when you exceed inverter limits or drain the pack quickly. The most reliable way to reduce surprises is to size capacity and output appropriately from the start. Calibration is a fine-tuning tool for the meter, not a fix for poor sizing or heavy loads.

Real-World Examples of Calibration and Full Discharge

Consider a remote work setup using a laptop, monitor, and internet router drawing around 120 watts combined. With a 600 watt-hour portable power station, basic math suggests five hours of runtime. After factoring in conversion losses, realistic runtime might be closer to four hours. If the display initially shows eight hours remaining and then suddenly drops to two, that inconsistency may indicate that the meter would benefit from recalibration.

In another scenario, a household uses a portable power station for short power outages to run a small refrigerator and a few LED lights. The fridge may draw about 80 watts running, with occasional higher surges, while the lights use around 10 watts total. With a 1000 watt-hour unit, they might expect around eight to nine hours of combined operation after losses. If the unit begins shutting off when the display still shows 25% charge in repeated outages, a controlled discharge and full recharge can help the state-of-charge estimate line up better with reality.

Cold-weather camping provides a different set of challenges. A power station used to run a small 12-volt heater fan and charge phones might appear to drain much faster in low temperatures. Part of this is real, because lithium batteries are less efficient and provide less usable capacity when cold. The state-of-charge meter can also become less accurate if the unit spends long periods in low temperatures and partial charge. A calibration cycle performed later at moderate room temperature can help restore more reliable readings.

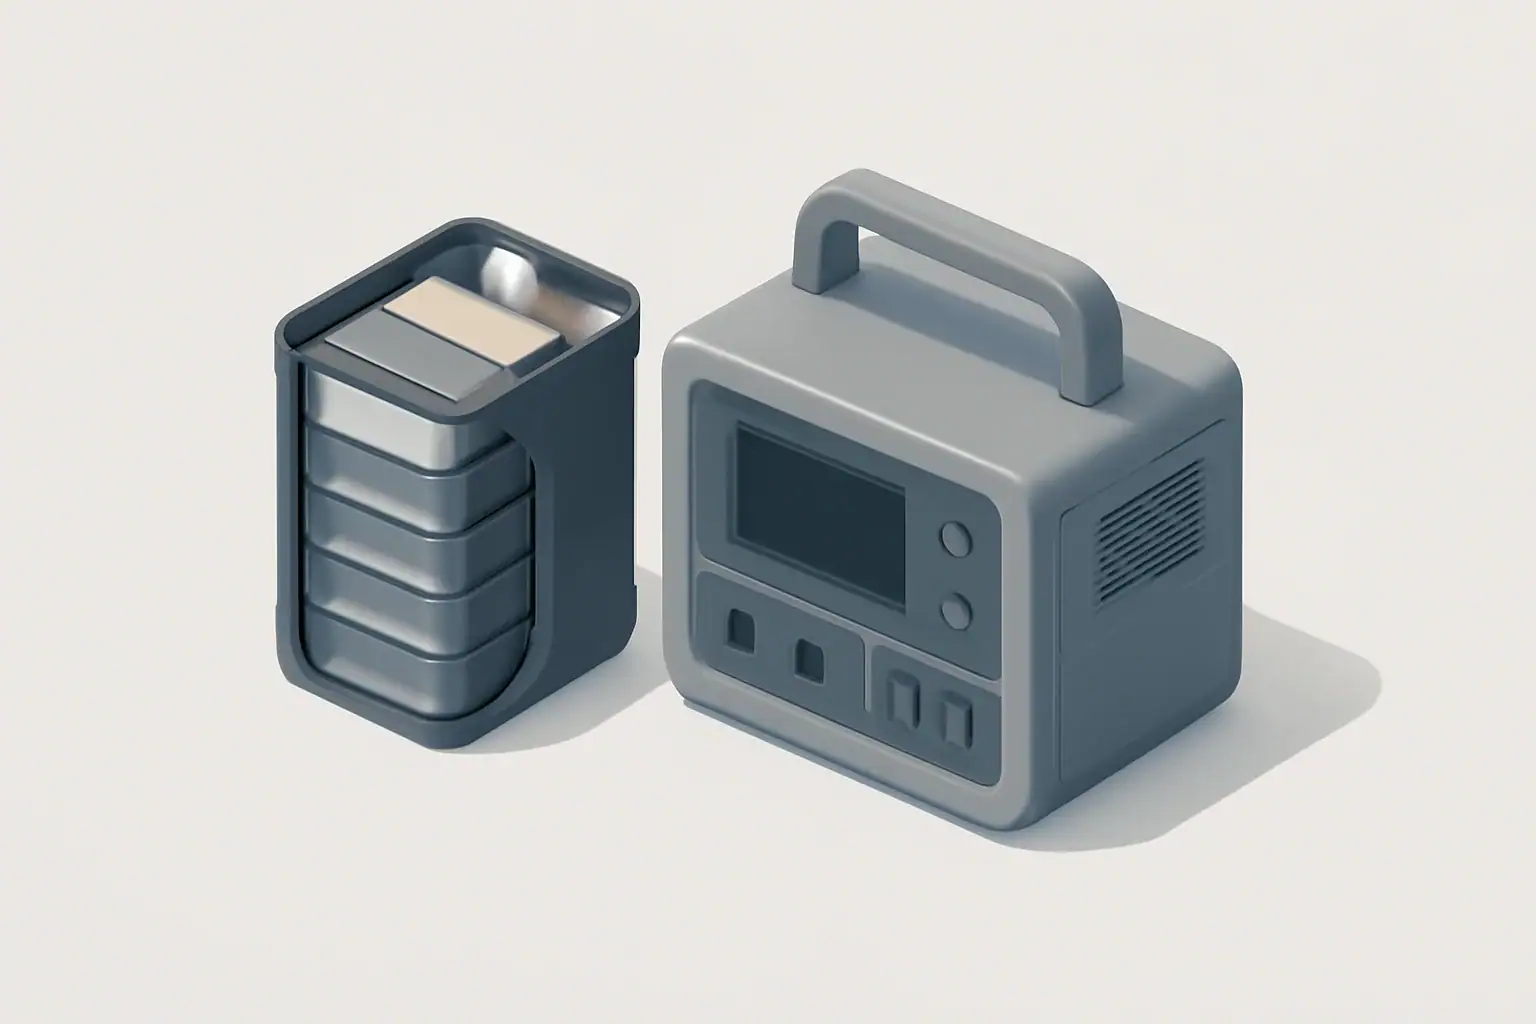
It is important to distinguish between normal battery aging and meter drift. Over years of use, any lithium battery will gradually lose capacity. If your once-new power station used to power a device for six hours and now lasts four, even after a careful full charge and a calibration discharge, that is likely normal wear rather than a calibration problem. Calibration can correct the gauge, but it cannot reverse chemical aging in the cells.

Common Mistakes and Troubleshooting Cues

A frequent mistake is treating full discharge as routine maintenance. Modern lithium-based portable power stations are generally healthier when kept away from extreme high and low states of charge. Regularly running the battery to zero for no clear reason can add unnecessary stress and may shorten its overall lifespan. Calibration cycles should be occasional, not part of everyday use.

Another common issue is assuming any unexpected shutdown is a sign the battery is “bad” or needs calibration. If the power station turns off as soon as a high-draw device starts, the inverter may be hitting its surge limit. If the unit heats up and reduces output or charging speed, it may be protecting itself from high temperature, not misreading remaining capacity. These are normal safety behaviors, and calibration will not change their thresholds.

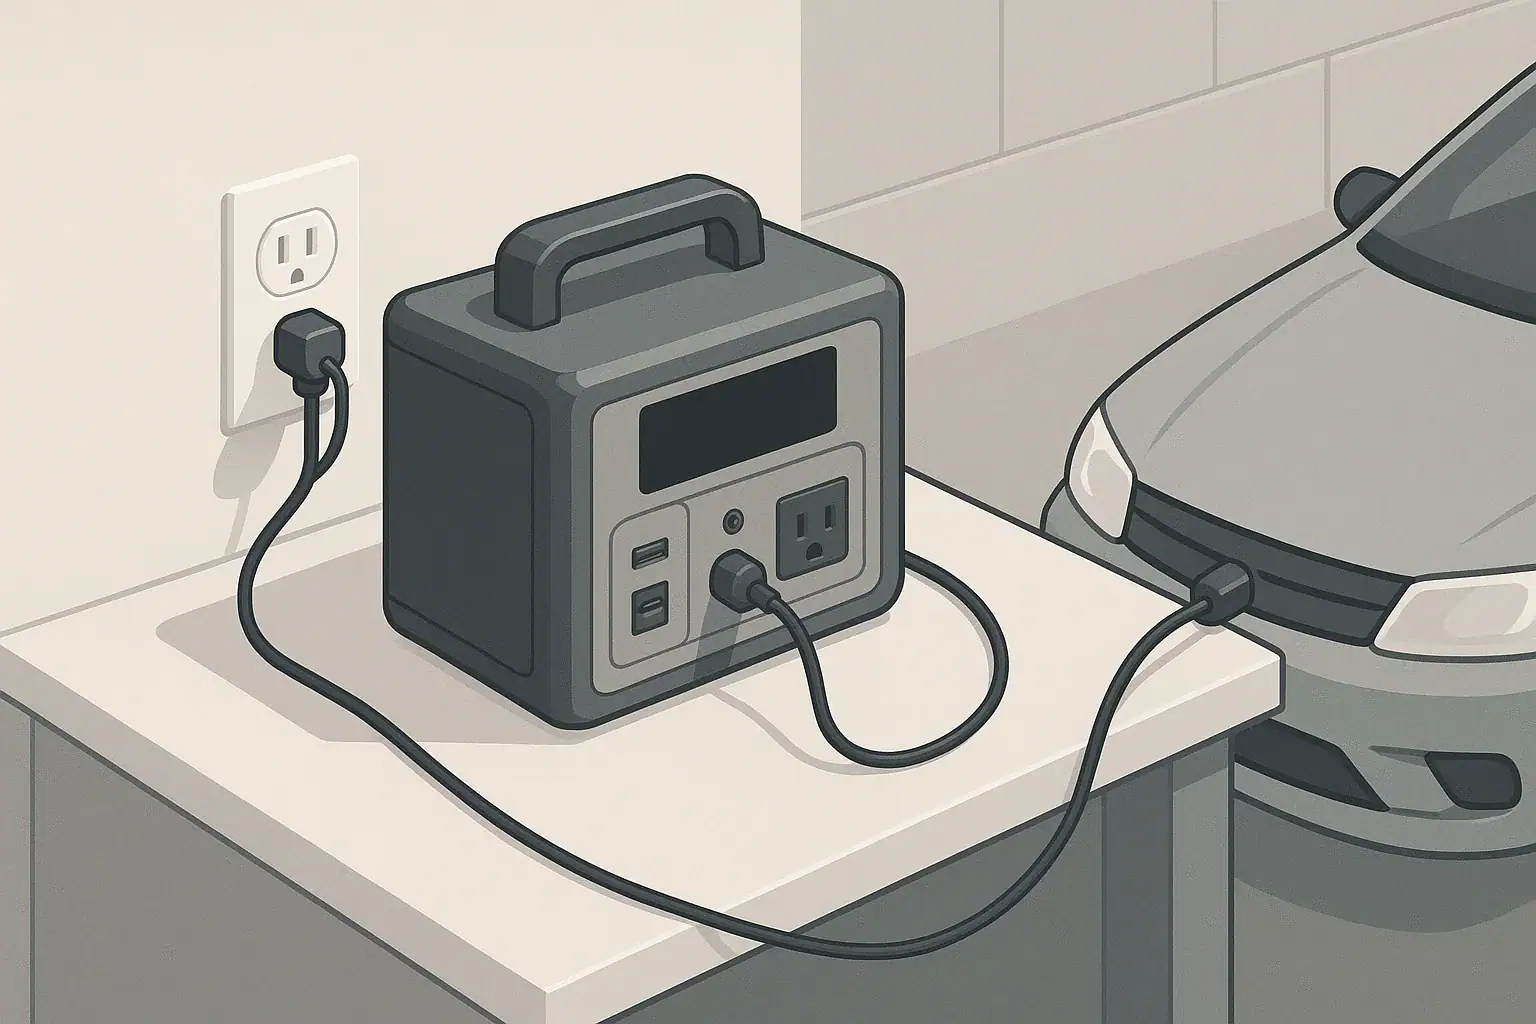
Slow charging is another area where users sometimes suspect a calibration problem. In reality, charging can slow down for several reasons: the power source may be limited (such as a car outlet), the battery may be near full and tapering current to protect itself, or the unit may be warm and reducing charge rate to manage temperature. If the percentage climbs steadily but slowly, that usually reflects real limits of the power source or battery protection, not a miscalibrated meter.

Signs that may point toward a useful calibration cycle include repeated shutdowns with a relatively high state of charge displayed, long periods where the percentage appears “stuck” at a certain level, or runtime estimates that are obviously out of proportion to your typical loads. Before assuming calibration is needed, it is wise to review your load wattage, inverter limits, and ambient temperature to rule out other causes.

Safety Basics: Using Power Stations and Calibration Wisely

Safe operation of a portable power station begins with placement. Use the unit on a stable, dry surface with adequate space around it for ventilation. Batteries and inverters generate heat during charging and discharging, and blocking vents can lead to higher internal temperatures, faster fan cycling, or protective shutdowns. Avoid placing the power station in enclosed cabinets, near heaters, or where direct sunlight can significantly raise its temperature.

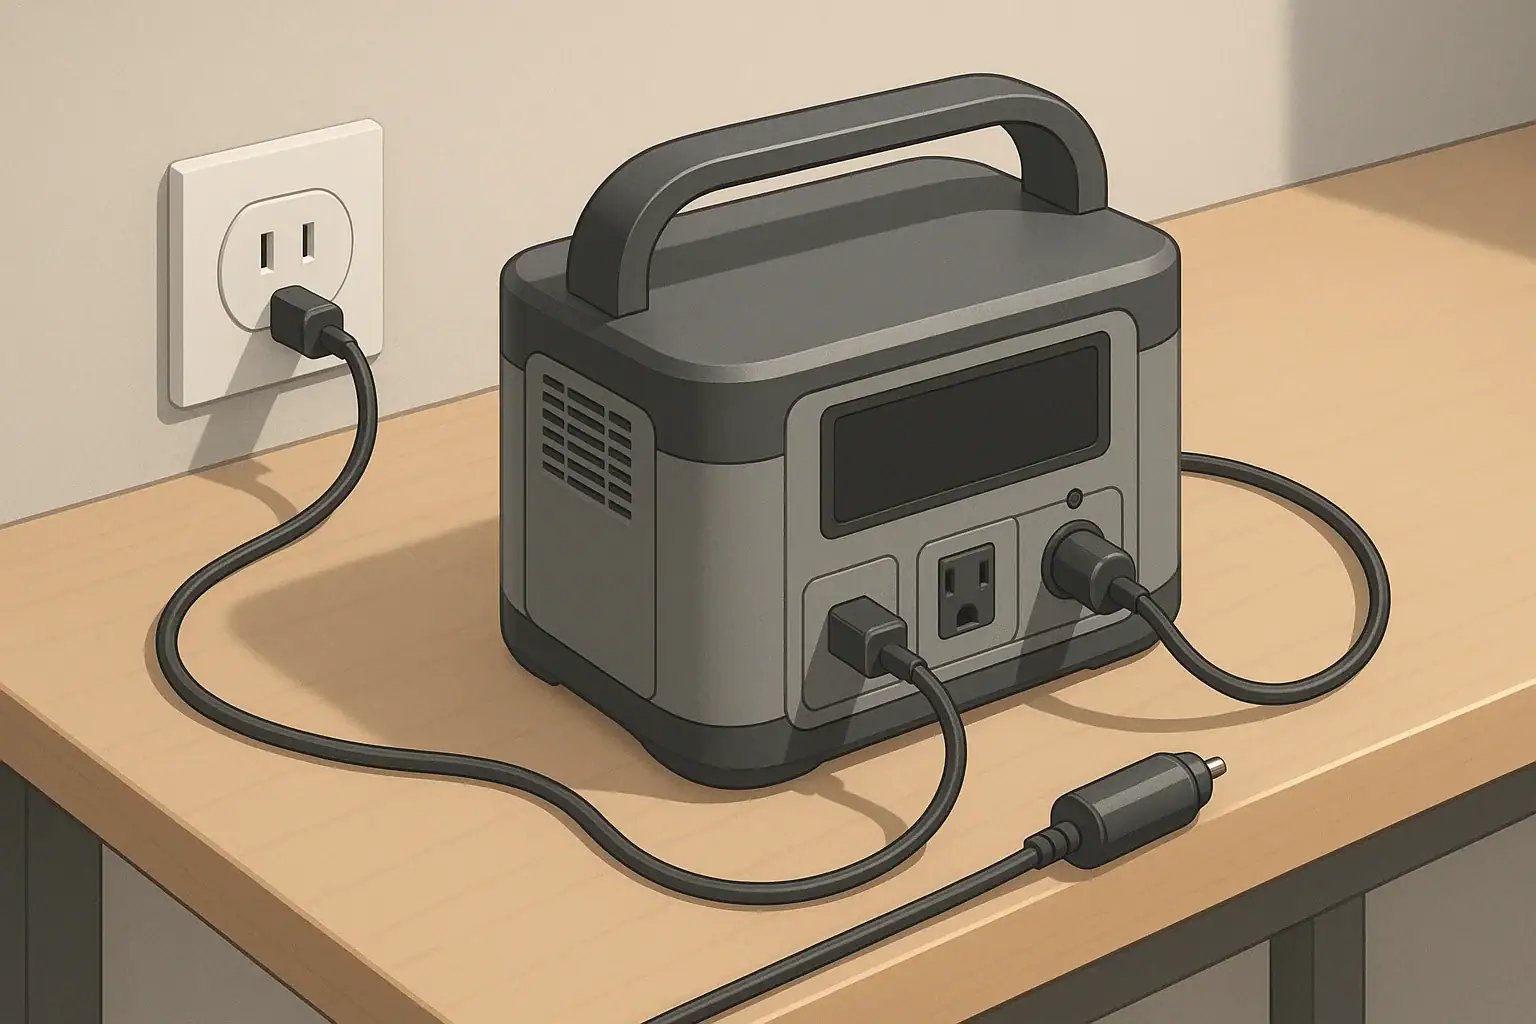
Cords and connected devices deserve just as much attention. Use appropriately rated power cords and avoid daisy-chaining multiple power strips or extension cords in ways that can overload wiring. Check that plugs are fully seated in outlets, both on the power station and on your devices. During any intentional calibration discharge, monitor connected loads and make sure that critical devices, such as medical or safety equipment, are not relying solely on a battery that is being purposefully run low.

Electrical safety also extends to moisture and grounding. Keep the power station away from standing water, rain, and very humid conditions unless it is specifically designed for outdoor exposure. When using near sinks, garages, or outdoor outlets, look for receptacles protected by ground-fault circuit interrupters (GFCI). These are typically installed and maintained by qualified electricians and help reduce the risk of shock in damp environments. Portable power stations themselves may have protective circuitry, but they do not replace properly installed building wiring.

It is crucial not to backfeed home wiring or attempt to connect a portable power station directly into household circuits without appropriate equipment and professional installation. Some households use transfer switches or dedicated inlets to safely connect backup power, but any design or installation related to the main electrical panel should be handled by a licensed electrician. Battery calibration and full discharge procedures should always be done with portable, plug-in loads, not through improvised connections to home wiring.

Maintenance and Storage: Protecting Capacity and Meter Accuracy

Good maintenance practices help both battery health and calibration accuracy. Portable power stations generally prefer being stored at a moderate state of charge, often somewhere in the middle range rather than at 0% or 100% for long periods. Many users aim to leave the battery around 40–60% if it will sit unused for several months, though you should also consider the manufacturer’s guidance for your particular unit. This reduces stress on the cells and slows capacity loss.

Self-discharge is another factor. Even when switched off, batteries gradually lose charge over time. The rate depends on design and temperature, but it is common for a stored power station to slowly drop several percentage points per month. Periodically checking and topping up the charge prevents it from drifting all the way to empty in storage. Very deep, unintentional discharge during long storage can be harder on the pack than normal shallow cycling.

Temperature during storage and use has a big impact on performance and lifespan. Extreme heat accelerates aging and can cause protective circuits to limit charging or discharging. Very low temperatures reduce available capacity and can lead to sluggish performance until the battery warms up. Storing your power station in a cool, dry indoor area, away from direct sunlight and unheated outbuildings that swing between hot and cold, helps preserve both the cells and the accuracy of the meter.

A calibration discharge, when needed, can be woven into normal maintenance rather than treated as a separate, frequent task. For example, once or twice a year, during regular use, you might allow the battery to run down under light to moderate load until the unit shuts itself off, then recharge it fully without interruptions. Between these rare calibration cycles, prioritize gentle use: avoid routinely running to empty, avoid leaving the battery at full for weeks on end, and keep the unit within comfortable room temperatures whenever possible.

Storage and maintenance planning for portable power stations. Example values for illustration.
Situation Suggested approach Notes
Storing for a few weeks Keep at moderate charge in a cool, dry place Avoid leaving at 0% or 100% for extended time
Storing for several months Charge to mid-level and check every 1–3 months Top up if display drops significantly
Using in hot environments Provide shade and ventilation, avoid closed cars High heat can increase aging and trigger slowdowns
Using in cold environments Keep unit insulated, warm gradually before heavy use Expect reduced runtime until temperature normalizes
Noticing meter inaccuracy Plan a careful discharge and full recharge Limit calibration cycles to occasional use
After many partial charges Allow a full cycle during normal use Helps the system re-learn top and bottom points
Before storm or outage season Fully charge, test runtime with typical loads Confirms capacity and reveals possible meter drift

Practical Takeaways: When and How to Use Full Discharge

Battery calibration is mainly about making the percentage and runtime estimates more trustworthy, not about fixing or expanding the battery’s real capacity. Most portable power station users do not need frequent calibration cycles. Instead, focus on correctly sizing your unit for the wattage and surge requirements of your devices, understanding that real runtimes will be somewhat lower than simple watt-hour math because of conversion losses.

Full discharge should be occasional and deliberate. Letting the unit run down naturally under light to moderate loads, then recharging it fully without interruptions, can help reset the meter if you see clear signs of drift. Avoid repeatedly forcing the battery to zero, especially with heavy loads or in very hot or very cold conditions, because that can add unnecessary wear.

  • Match your power station’s continuous and surge watt ratings to your planned loads.
  • Use watt-hours as a planning tool, then apply a margin for inverter and efficiency losses.
  • Treat unexpected shutdowns as a cue to check load size, temperature, and inverter limits before assuming a calibration issue.
  • Store the battery at a moderate state of charge in a cool, dry location, and avoid long periods at 0% or 100%.
  • Plan calibration discharges only when the meter behaves inconsistently, not as routine maintenance.
  • Keep safety first: ensure good ventilation, appropriate cords, dry conditions, and avoid any improvised connections to building wiring.

By combining right-sized capacity, sensible operating habits, and occasional calibration when truly needed, you can keep your portable power station both accurate and reliable across a wide range of everyday and emergency uses.

Frequently asked questions

Is a full discharge necessary for battery calibration on portable power stations?

No. Routine full discharges are not required for modern lithium-based power stations. A controlled full discharge and subsequent full charge are only useful occasionally when the state-of-charge display or runtime estimates show consistent, obvious errors.

How often should I perform a calibration full discharge?

Perform calibration discharges sparingly—typically only when you notice persistent meter drift such as repeated shutdowns at a seemingly high displayed charge or long periods where the percentage is “stuck.” For many users, once a year or after long periods of partial charging is sufficient; don’t make it a regular maintenance routine.

Will doing a full discharge restore the battery’s real capacity?

No. A full discharge only helps the battery management system better estimate top and bottom points; it does not reverse chemical aging or recover lost cell capacity. Frequent deep discharges can actually accelerate capacity loss, so limit them to diagnostic or calibration needs.

What is the safest way to perform a calibration discharge?

Use light to moderate resistive loads, monitor the unit and ambient temperature, avoid running critical devices on the battery being discharged, and allow the unit to shut off on its own before fully recharging without interruption. Perform the cycle in a ventilated, dry area at moderate room temperature for best results.

Does temperature affect meter accuracy and calibration timing?

Yes. Cold reduces apparent capacity and can cause inaccurate state-of-charge readings, while heat accelerates aging and may alter charging behavior. Perform calibration at moderate room temperature and avoid calibrating while the unit is very cold or very hot to get useful reference points.

Fast Charging vs Battery Life: C-Rate Explained for Portable Power Stations (No Hype)

Portable power station charging from wall and car outlets

Portable power stations store energy in rechargeable batteries and let you run devices when wall power is not available. Two ideas often get mixed together when people compare models: how fast the battery can be charged, and how long the battery will last over months and years. The connection between the two is largely governed by something called the C-rate.

C-rate is a way to describe how quickly a battery is charged or discharged relative to its capacity. A 1C charge rate means charging a battery from empty to full in about one hour in theory. A 0.5C rate would take about two hours, and 2C would be about half an hour. Real charge times are longer because charging slows down as the battery approaches full, but the C-rate gives a useful comparison point.

For portable power stations, higher C-rate charging can mean less time plugged into the wall, car, or solar, which is helpful during short stops or power outages. However, regularly pushing batteries at very high C-rates can increase heat and stress, which may reduce long-term battery health. Understanding C-rate helps you balance fast charging convenience with reasonable expectations for battery life.

Instead of chasing the highest advertised charging speed, it is more practical to understand how C-rate, capacity, and your actual usage fit together. That way, you can tell whether a power station will realistically recharge between uses and how hard you are asking the battery to work.

What fast charging and C-rate really mean for portable power stations

Portable power stations store energy in rechargeable batteries and let you run devices when wall power is not available. Two ideas often get mixed together when people compare models: how fast the battery can be charged, and how long the battery will last over months and years. The connection between the two is largely governed by something called the C-rate.

C-rate is a way to describe how quickly a battery is charged or discharged relative to its capacity. A 1C charge rate means charging a battery from empty to full in about one hour in theory. A 0.5C rate would take about two hours, and 2C would be about half an hour. Real charge times are longer because charging slows down as the battery approaches full, but the C-rate gives a useful comparison point.

For portable power stations, higher C-rate charging can mean less time plugged into the wall, car, or solar, which is helpful during short stops or power outages. However, regularly pushing batteries at very high C-rates can increase heat and stress, which may reduce long-term battery health. Understanding C-rate helps you balance fast charging convenience with reasonable expectations for battery life.

Instead of chasing the highest advertised charging speed, it is more practical to understand how C-rate, capacity, and your actual usage fit together. That way, you can tell whether a power station will realistically recharge between uses and how hard you are asking the battery to work.

Key concepts and sizing logic: watts, watt-hours, and C-rate

When planning a portable power setup, it helps to separate three basic ideas: power, energy, and charge rate. Power is measured in watts (W) and describes how quickly energy is being used at a moment in time. Energy capacity is measured in watt-hours (Wh) and describes how much total work the battery can do before it needs to be recharged. C-rate ties the two together when you look at how quickly that stored energy moves in or out of the battery.

Battery capacity in watt-hours tells you how long a load can run in theory. For example, a 500 Wh battery feeding a 100 W load could supply that load for about 5 hours: 500 Wh divided by 100 W equals 5 hours. In practice, inverter losses, internal resistance, and other inefficiencies reduce this runtime. A reasonable planning assumption is that you may see 80–90% of the rated watt-hour capacity delivered to AC outlets, depending on how heavily they are loaded.

C-rate uses the battery’s amp-hour (Ah) rating to express charge or discharge current relative to size, but you can think of it in watt-hour terms for power stations. If a 500 Wh battery is being charged at 250 W, that is roughly a 0.5C charge rate: at that pace, a full empty-to-full charge would take about two hours in an ideal case. If the same battery were charged at 500 W, that would be about 1C. Higher C-rate means higher power moving through the system, which increases heat and may require the power station’s fans to run more often.

Inverter ratings add another important layer: the continuous (running) watt rating and the surge (peak) watt rating. The continuous rating is what the inverter can supply steadily. Surge rating describes short bursts to handle motor start-up or inrush current, such as from a refrigerator compressor or power tool. Running devices close to the continuous rating tends to reduce efficiency and increase heat, which also affects effective C-rate on discharge and can shorten runtime.

Decision matrix for balancing charge rate, capacity, and usage – Example values for illustration.
Scenario Example battery size Example charge power Approx. C-rate What this usually means
Occasional home backup for small essentials 500–700 Wh 150–250 W 0.2C–0.5C Slower charges, gentler on battery, easier on household circuits
Daily remote work and electronics 700–1200 Wh 250–400 W 0.3C–0.6C Balanced charge time and battery stress for regular use
Frequent fast top-offs between errands 300–600 Wh 300–600 W 0.5C–1C Shorter charge windows, more fan noise and heat
RV or vanlife with solar emphasis 1000–2000 Wh 200–600 W solar ~0.1C–0.3C mid-day Longer charge cycles, more battery-friendly if shaded heat is managed
High-demand tools used briefly 700–1500 Wh 400–800 W wall charging 0.3C–0.8C Need faster recharge, but avoid using maximum rate constantly
Emergency-only, long shelf life priority 300–1000 Wh 100–200 W 0.1C–0.3C Slower charging, less stress, better for occasional use

Efficiency losses and real-world charge times

When planning charge time, it is helpful to remember that power stations are not 100% efficient. Some power is lost as heat in the AC adapter or built-in charger, in the battery’s internal resistance, and in the inverter if it is running during pass-through use. A simple rule of thumb is that you may need 10–25% more watt-hours from the wall than the battery’s rated capacity to fill it from low to full.

Charge curves are also not flat. Most systems charge quickly up to a certain percentage, then taper off to protect the battery as it nears full. That means a power station might go from 20% to 80% much faster than from 80% to 100%. From a C-rate perspective, the initial phase uses a higher effective C-rate, and the final top-off phase uses a lower rate. If you only need enough energy to ride through a short outage or finish a workday, stopping around 80–90% can save time and reduce heat.

Real-world examples of C-rate, fast charging, and runtime

Relating C-rate to real-life situations makes it easier to judge what is “fast enough.” Imagine a portable power station with about 500 Wh of capacity. If it can charge from the wall at about 250 W, that is roughly a 0.5C rate. In simple terms, that means you could go from low to near full in a bit over two hours under typical conditions, allowing for efficiency losses and tapering.

Take that same 500 Wh unit on a camping trip. If you run a 50 W portable fridge and 20 W of lights for 8 hours overnight, that is about 560 Wh of load. Accounting for losses, you might use most of the battery in one night. To be ready for the next evening, you would want to recharge at least 400–500 Wh during the day. With a 250 W wall or generator charger, that might take around 2–3 hours; with a 100 W solar input, it might take most of a sunny day.

For remote work, consider a 700–1000 Wh power station running a 60 W laptop, 10 W router, and a few watts of phone charging and small accessories. At a 90 W total draw, a 900 Wh battery might deliver around 7–8 hours of runtime once you factor in inverter losses. If that same unit supports 400 W wall charging, you could restore a large portion of that capacity in a long lunch break, operating at around a 0.4C–0.5C charge rate.

In an RV, a larger 1500–2000 Wh power station might be recharged mainly through solar. Suppose you have 400 W of panels and get about 4–5 effective hours of good sun. That could provide 1600–2000 Wh of input on a clear day, corresponding to roughly a 0.2C–0.3C rate for a 2000 Wh battery. This slower C-rate is gentle on the battery, but you need to manage your loads so that daily use does not consistently exceed daily solar input.

Common mistakes and troubleshooting cues

Many charging and runtime issues come from misunderstandings about C-rate, load size, and what a portable power station is designed to do. One common mistake is assuming the advertised “from 0% to 80% in X minutes” claim applies under all conditions. In reality, temperature, state of charge, and input source (wall vs car vs solar) all influence the actual C-rate the battery sees.

Another frequent issue is overloading the inverter by confusing surge watts with continuous watts. If you plug in a device whose steady draw is close to or above the continuous rating, the power station may shut down or repeatedly trip its protection circuits. Motors, compressors, and some electronics can draw several times their running wattage during startup. If that surge exceeds the inverter’s short-term peak rating, you may see flickering, beeping, or immediate shutdown.

Charging can also slow down or pause when the power station gets hot. Fast charging at a high C-rate, especially in a warm room or vehicle, builds heat quickly. Internal temperature sensors may reduce charge power well below the maximum rating to protect the battery, or even stop charging until the system cools. If you notice the fan running constantly or feel the case getting warm, that is a cue to improve airflow or consider lowering the input power if the device allows it.

Pass-through charging, where the power station is charging while powering devices, can be confusing. If the output load is high, much of the incoming energy is immediately used by the connected devices rather than replenishing the battery. The display may show that it is charging, but the state of charge might climb very slowly or even drop. In extreme cases, the system may throttle charging or shut off outputs to stay within safe C-rate and thermal limits.

Signals your system is being pushed too hard

There are several warning signs that your portable power station is operating at a higher C-rate or load level than it comfortably supports. These are not necessarily failures, but they are cues to reduce stress on the system.

  • Fans running at high speed most of the time during charging or heavy use
  • Frequent thermal or overload warnings on the display or indicator lights
  • Charging power starting high, then dropping sharply after a short time
  • Noticeable case warmth, especially near vents or the charging side
  • Shorter runtimes than expected at a given load, due to elevated temperatures and losses

When you see these signs, try moving the unit to a cooler, shaded area with better airflow, reducing the load, or allowing the battery to cool before another full-power charge. These simple adjustments can reduce unnecessary battery stress and help preserve long-term capacity.

Safety basics: heat, placement, cords, and GFCI context

Fast charging and high C-rates mean more heat inside a compact enclosure, so placement and ventilation are important. Always use your portable power station in a dry, well-ventilated area where air can move freely around the vents. Avoid covering the unit with blankets, clothing, or gear, and do not place it in enclosed cabinets or tight spaces where hot air cannot escape.

Heat is one of the main factors that shortens battery life. Charging or discharging at high C-rates in hot environments raises internal temperatures and can accelerate aging. Keeping the unit out of direct sun and away from heaters, dashboards, or enclosed vehicle trunks during use and charging can significantly reduce thermal stress. When possible, operate the power station on a firm, non-flammable surface rather than carpets or bedding.

Extension cords and adapters also matter. Undersized or damaged cords can heat up under high loads, especially when running close to the power station’s continuous rating. Use cords rated for at least the maximum current you expect to draw, keep them fully uncoiled to avoid heat buildup, and inspect them regularly for nicks, loose plugs, or discoloration. For outdoor or damp environments, use cords and power strips designed for those conditions.

Many household circuits and outdoor outlets are protected by GFCI devices, which are designed to reduce shock risk in wet or grounded locations. Plugging a portable power station into a GFCI-protected outlet for charging is typically acceptable, but avoid daisy-chaining multiple power strips, cords, and adapters. If you encounter tripping or unusual behavior, disconnect everything and simplify the setup. For any connection involving a building’s wiring beyond standard plug-in use, consult a qualified electrician instead of attempting your own modifications.

Maintenance and storage for long battery life

How you treat a portable power station between uses can matter almost as much as how you charge it. Batteries slowly lose charge even when turned off, a process called self-discharge. The rate varies, but it is normal to see a few percent of charge fade per month. Plan to check the state of charge periodically, especially if the unit is stored for emergencies.

Most lithium-based batteries prefer to be stored partially charged rather than completely full or empty. A common recommendation is to keep long-term storage in the middle range, such as around 40–60% state of charge. This reduces stress on the cells while still keeping enough energy on hand for short-notice use. If you store the unit at a very low charge for too long, the battery may fall below its safe voltage range and the protection circuitry can prevent normal charging.

Temperature during storage is another key factor. Moderate, dry conditions are best. Extremely hot environments, such as attics or parked vehicles in summer, can accelerate aging even when the battery is not in use. Very low temperatures do not usually damage the battery by themselves, but charging at or below freezing can be harmful. If the power station has been stored in the cold, let it warm to room temperature before charging.

Routine checks help you catch small issues before they become larger problems. Inspect cables, wall adapters, and ports for wear or debris. Gently clean dust from vents with a dry cloth or low-pressure air so the cooling system can work properly during high C-rate charging or discharging. Turn the unit on occasionally to verify that the display, ports, and outlets function as expected, especially if you rely on it for backup power.

Storage and maintenance plan by usage pattern – Example values for illustration.
Usage pattern Suggested storage charge level Check/charge interval Key maintenance focus
Emergency-only home backup 40–60% Every 3–6 months Top up charge, test a small load, inspect cords and outlets
Seasonal camping or RV 40–70% Before and after each season Clean vents, verify solar inputs, confirm charge settings
Weekly remote work use 50–80% between sessions Weekly Monitor runtime changes, watch for excess heat or fan noise
Daily mobile power (vanlife) 30–80% cycling Monthly deep check Inspect all cables, clean dust, review charging sources and limits
Tool and jobsite backup 50–80% Monthly or before major jobs Check inverter output under load, inspect cords for damage
Mixed household and travel 40–70% Every 2–3 months Test various ports, ensure adapters and accessories are stored together

Practical takeaways: balancing fast charging and battery life

Understanding C-rate turns fast charging claims into useful planning tools instead of marketing numbers. Higher C-rate charging and discharging give you flexibility during outages, travel, and short charge windows, but they also increase heat and long-term wear. For most users, a moderate C-rate that refills the battery over a few hours offers a good balance of convenience and longevity.

Rather than focusing only on maximum charging watts, match your portable power station’s capacity and charge rate to your actual loads and schedules. Think about how long you need to run key devices, how much time you have between uses to recharge, and what energy sources you can rely on. Planning with realistic runtimes and charge times will help you avoid surprises when you need power most.

  • Size the battery in watt-hours to cover your typical loads with a buffer for inefficiencies.
  • View maximum charge power as an upper limit, not a requirement to use at every cycle.
  • Watch for signs of thermal stress such as constant fan noise and warm casing during use.
  • Store the unit partially charged in a cool, dry place and check it periodically.
  • Use appropriate cords and outlets, and avoid stacking adapters or modifying wiring.
  • Allow extra time for charging in hot weather or when using pass-through power.

With these habits, you can take advantage of fast charging when it truly helps, while giving the battery conditions that support a long, reliable service life.

Frequently asked questions

What C-rate is recommended for daily charging of a portable power station?

A moderate C-rate around 0.3C–0.6C is a good balance for daily use because it refills most capacity in a few hours without causing excessive heat. Exact safe rates vary by battery chemistry and manufacturer guidance, so follow the unit’s specifications when available.

How does charging at a high C-rate affect long-term battery lifespan?

Higher C-rates increase internal heat and mechanical stress on cells, accelerating capacity loss and reducing cycle life over time. Occasional fast charges are acceptable, but frequent high-C charging will generally shorten the battery’s useful life compared with gentler charging.

How can I estimate real-world charge time from C-rate and watt-hours?

Divide charge power (W) by battery capacity (Wh) to find approximate C-rate (for example, 250 W into 500 Wh ≈ 0.5C). The theoretical empty-to-full time is about 1/C hours, but real-world charging takes longer due to tapering and inefficiencies—add roughly 10–25% extra time and expect the final 10–20% to take disproportionately longer.

Is pass-through charging (charging while powering devices) safe to use often?

Pass-through is typically safe for occasional use, but when loads are high much of the incoming power goes to running devices rather than charging the battery, which raises heat and can trigger throttling. Frequent pass-through at high loads or in warm conditions can increase wear and reduce battery lifespan.

What signs show my power station is being charged too fast?

Look for constant high fan speed, thermal or overload warnings, rapid drops in displayed charge power, and a noticeably warm case near vents—these indicate heat-related stress or throttling. If observed, reduce input power, improve ventilation, or allow the unit to cool before further high-rate charging.

Can solar fast-charging deliver high C-rates safely for portable power stations?

Solar can provide substantial charge power, but effective C-rate depends on panel wattage, sun conditions, and the station’s charge controller. High daytime solar input spread over several hours is usually gentle, but pairing large solar input with hot temperatures or a small battery can raise internal temperatures and accelerate wear, so use MPPT control and manage ventilation.

Charging From a Car: What’s Safe, What’s Slow, and What Can Break

Portable power station charging from a car outlet in a garage

Why Charging a Portable Power Station From a Car Is Tricky

Charging a portable power station from a vehicle sounds simple: plug it into the car outlet and top it up while you drive. In reality, the details matter a lot for safety, charging speed, and long-term battery health.

This guide focuses on three key questions:

  • What car charging methods are generally safe?
  • What setups will work, but very slowly or inefficiently?
  • What can damage your portable power station, your vehicle, or both?

The information below applies broadly to most modern portable power stations, whether they use lithium-ion or LiFePO4 batteries.

Common Ways to Charge From a Car

There are several paths for getting energy from your vehicle into a portable power station. Each has different limits and risks.

1. Direct 12 V Car Socket (Cigarette Lighter)

This is the most common method. Many portable power stations include a cable for the 12 V accessory socket in a car.

Typical specs:

  • Voltage: about 12–14.4 V DC (when the engine is running)
  • Current limit: often 10 A, 15 A, or 20 A per socket (check vehicle manual and fuse)
  • Power: usually 120–180 W per socket in real-world use

Pros:

  • Simple: plug-and-play with the right cable
  • Generally safe when within current limits
  • Works while driving; many vehicles power the socket only with ignition on

Cons:

  • Slow for larger power stations (500 Wh and up)
  • Limited by factory socket fuses and wire size
  • Can drain the starter battery if used with the engine off

2. Hardwired 12 V or 24 V DC Connection

Some vehicle owners install a dedicated high-current DC line from the battery (or a distribution block) to a rear cargo area or cabin. This can be used to feed the DC input of a portable power station.

Pros:

  • Higher current capacity than stock accessory sockets
  • Better for larger power stations or faster DC input rates
  • Can be configured with proper fusing and heavy-gauge wire

Cons:

  • Requires correct wiring practices and fusing
  • Greater risk to the vehicle’s electrical system if done incorrectly
  • Still limited by the alternator’s available output

3. Charging Through a Small Inverter Plugged Into the Car

Another approach is to plug a small inverter into the 12 V socket and then plug the portable power station’s AC charger into that inverter.

Pros:

  • Compatible with power stations that only charge through AC
  • No custom wiring required

Cons:

  • Stacked losses: DC (car) → AC (inverter) → DC (charger) waste energy
  • Limited by socket current rating
  • Possible overload of the car socket or inverter if not sized correctly

4. Direct Alternator-to-Battery Charging Systems (DC–DC Chargers)

Some vehicle and overland builds use a dedicated DC–DC charger between the vehicle’s starter battery/alternator and auxiliary batteries. A portable power station can sometimes be integrated into such a system, but this is more advanced.

Pros:

  • Can provide controlled, higher-power charging
  • Designed to protect the starter battery and alternator
  • Useful for frequent off-grid use

Cons:

  • Complex installation and configuration
  • Must ensure voltage and current are compatible with the power station’s DC input
  • Overkill for occasional car charging

What’s Generally Safe

Safety depends on matching the portable power station’s input requirements with what the vehicle can comfortably provide.

Safe Voltage Matching

Most portable power stations accept a range of DC input voltages, often around 12–28 V or 10–30 V. Always check:

  • Allowed input voltage range for the DC/car charging port
  • Polarity (center positive vs center negative on barrel connectors)
  • Maximum input current or power rating

If your vehicle is a standard 12 V system and the power station lists a compatible car input, using the supplied car charging cable is usually safe.

Staying Under Fuse and Socket Limits

Factory 12 V sockets are protected by fuses. Common ratings:

  • 10 A fuse ≈ safe up to about 120 W
  • 15 A fuse ≈ safe up to about 150–180 W
  • 20 A fuse ≈ safe up to about 200–240 W

To stay safe:

  • Check the fuse rating for the specific socket you plan to use
  • Check the power station’s maximum car input power
  • If the power station can draw more than the socket can handle, use a lower current mode if available

Fuses are there to protect wiring from overheating. Replacing a blown fuse with a higher value to “get more power” is not safe and can lead to melted wires or fire.

Charging While the Engine Is Running

The safest time to draw significant power is while the engine is running and the alternator is charging.

Benefits:

  • Reduces the risk of draining the starter battery
  • Voltage is more stable under load
  • Alternator can supply more continuous current than a resting battery

Short engine-off charging sessions at low power can be acceptable, but high-power charging with the engine off can quickly deplete the starter battery.

Cable Quality and Connection Safety

Use cables designed for automotive DC loads:

  • Heavy enough gauge wire for the current (lower AWG number for higher current)
  • Secure, tight-fitting plugs that do not wiggle or arc
  • No frayed insulation, exposed copper, or improvised adapters

Loose or undersized connections can overheat, which is a common failure point in car charging setups.

What’s Slow (But Still Works)

Many car charging methods will technically work but are slower than people expect, especially with larger-capacity power stations.

Understanding Power and Time

Charging speed depends on power (watts) and capacity (watt-hours). A simple approximate formula:

Charge time (hours) ≈ Battery capacity (Wh) ÷ Charging power (W) ÷ 0.85

The 0.85 factor accounts for typical charging losses.

Examples:

  • 500 Wh power station at 100 W from car: 500 ÷ 100 ÷ 0.85 ≈ 6 hours
  • 1000 Wh power station at 120 W from car: 1000 ÷ 120 ÷ 0.85 ≈ 9.8 hours
  • 1500 Wh power station at 120 W from car: 1500 ÷ 120 ÷ 0.85 ≈ 14.7 hours

This illustrates why car charging is often described as “overnight” or “all-day” for larger units.

Car Socket Limits in Real Use

Even if a socket is fused for 15 A, you might not get full rated current:

  • Voltage drop in long or thin wires reduces actual power
  • Some vehicles limit output when hot or under heavy load
  • Sockets may share a fuse or wiring run with other accessories

As a result, practical continuous power may be closer to 80–120 W, which extends charging times.

Using a Small Inverter in the Car

When using a small inverter plugged into a 12 V socket:

  • The inverter might be rated for, say, 150–300 W
  • The car socket might only reliably support around 120–150 W
  • The portable power station’s AC adapter might be rated for 100–200 W

Stacking these limits usually forces you to run things well below the inverter’s advertised maximum, which again leads to slow charging.

Engine-Off “Top-Up” Sessions

Short periods of engine-off charging at low power (e.g., 50–80 W) can be useful to:

  • Top up the power station slightly without idling for long
  • Use spare energy from a partially charged starter battery

But because power is low and you must protect the starter battery from deep discharge, those sessions are best considered as small incremental boosts rather than full charges.

What Can Break or Cause Damage

Certain practices can harm the portable power station, the vehicle, or both. Understanding these risks helps avoid expensive repairs.

Overloading the Car Socket or Wiring

Drawing more current than a socket or wire was designed for can cause:

  • Repeated blown fuses
  • Melted or discolored plug ends
  • Overheated wiring behind panels or under the dash

Warning signs include:

  • Warm or hot 12 V plugs and sockets
  • Plastic odor near the outlet
  • Intermittent power or devices cutting out under load

If you encounter these symptoms, reduce load immediately and inspect the setup.

Draining the Starter Battery Too Far

Portable power stations can draw steady current for many hours. If the engine is off, that current comes directly from the starter battery.

Risks of deep discharge:

  • Car won’t start when you need it
  • Shortened starter battery lifespan
  • Potential damage to battery plates from deep cycling

Starter batteries are designed for short, high-current bursts, not long, deep discharges. Using them like a house battery will wear them out quickly.

Incorrect Polarity and DIY Connectors

Reversing positive and negative leads is one of the fastest ways to damage electronics. Common problem areas include:

  • Homemade 12 V cables with reversed connectors
  • Incorrectly wired Anderson-style or other DC plugs
  • Mixing up polarity between different vehicle or trailer sockets

Some portable power stations have reverse-polarity protection, but not all. A reversed connection can cause:

  • Blown internal fuses
  • Burned input circuitry
  • Permanent failure of the DC input port

Feeding Unsafe Voltage Into the DC Input

Many DC inputs have a maximum voltage rating. For example, a unit might accept 12–28 V but not 48 V. Common pitfalls:

  • Connecting to a 24 V truck system when only 12 V is supported
  • Using a DC–DC booster that outputs more than the rated voltage
  • Connecting in series with other sources to “speed up” charging

Overvoltage can permanently damage the charging circuit, even if it occurs for only a short moment.

Running the Alternator Beyond Its Comfort Zone

Alternators have a continuous output rating, but they also have to power:

  • Engine management systems
  • Lights and climate control
  • Onboard electronics and accessories

Adding a large continuous charging load from a portable power station can, in some situations:

  • Overheat the alternator, especially in hot weather and at low engine speeds
  • Cause premature alternator wear
  • Lead to voltage drops that upset other vehicle electronics

This risk is higher when using hardwired high-current connections or high-power DC–DC chargers, especially on smaller alternators.

Poor Mounting and Heat Buildup

Portable power stations and inverters generate heat while charging. In vehicles, they are often placed:

  • Under seats
  • In small compartments
  • In packed trunks without airflow

Insufficient ventilation can cause:

  • Thermal throttling and slower charging
  • Overheating and protective shutdowns
  • In extreme cases, damage to components

Ensure fan vents are not blocked and that there is space for air to move around the unit.

Practical Setup Examples

To clarify the concepts, here are some typical scenarios and how they usually play out.

Scenario 1: Small Power Station on a Weekend Road Trip

Equipment:

  • Power station around 300–500 Wh
  • Factory 12 V car outlet with 10–15 A fuse
  • Supplied 12 V car charging cable

Usage pattern: Charge while driving, run small devices (phone, camera, laptop) off the power station while parked or camping.

Result:

  • Charging at around 60–100 W is reasonable
  • Several hours of driving can replenish most or all of the capacity
  • Risk to the vehicle is low if you avoid long engine-off sessions

Scenario 2: Large Power Station on a Long Road Trip

Equipment:

  • Power station around 1000–1500 Wh
  • Vehicle with a 15 A accessory socket
  • Supplied car charging cable

Usage pattern: Charge while driving, run a fridge and other loads while parked.

Result:

  • Charging limited to about 120–150 W
  • Full charge may take an entire day of driving
  • Power station may not reach 100% if loads are running simultaneously

Risks: If power draw from the 12 V socket is pushed to its upper limit for many hours, plug and socket heating should be monitored.

Scenario 3: Custom Hardwired High-Current Setup

Equipment:

  • Large power station with higher-power DC input
  • Dedicated fused line from vehicle battery to cargo area
  • Appropriate gauge wire and connectors

Usage pattern: Frequent off-grid use, charging the power station at higher DC rates while driving.

Result:

  • Faster charging than the standard socket, depending on alternator capacity
  • Better suited for daily cycling in vanlife or work vehicles

Risks:

  • Incorrect wiring, undersized cable, or poor connections can overheat
  • High continuous loads can stress the alternator over time
  • Improper fuse sizing can turn faults into serious hazards

Best Practices for Safe, Effective Car Charging

With the trade-offs in mind, a few guidelines help keep things safe and predictable.

Match the Charger to the Input

  • Use the manufacturer-supplied car charging cable when possible
  • If using third-party cables or adapters, confirm voltage, polarity, and connector type
  • Avoid stacking multiple adapters that can introduce resistance and heat

Respect Vehicle Limits

  • Check your vehicle manual for accessory socket current ratings
  • Avoid pulling the full fuse rating continuously for hours; stay with a safety margin
  • Do not upsize fuses beyond their original rating

Protect the Starter Battery

  • Prefer charging while the engine is running
  • If charging engine-off, use low power and monitor time
  • Stop charging if cranking becomes noticeably slower or if the power station reports low input voltage

Monitor Temperature and Connections

  • Periodically feel plugs and cables; they should be warm at most, not hot
  • Ensure cables are routed to avoid pinching, sharp edges, and moving parts
  • Keep the portable power station in a ventilated area, not under thick blankets or tightly packed gear

Plan Around Slow Car Charging

  • Treat car charging as a top-up method, not always the primary source
  • Combine it with faster methods (AC at home, campsite hookups, or solar) when available
  • Size your power station capacity and loads with realistic car charging rates in mind

Key Takeaways

  • Factory 12 V sockets are safe for modest charging power when used within their fuse ratings and with proper cables.
  • Car charging is often slow compared with wall charging, especially for high-capacity portable power stations.
  • The biggest risks are overloading outlets, draining the starter battery, incorrect wiring or polarity, and overheating from poor ventilation or undersized wiring.
  • For frequent, high-power car charging, purpose-built wiring and charging hardware, correctly installed and fused, can reduce risk but require more planning.

With realistic expectations and attention to basic electrical limits, charging a portable power station from a car can be a reliable part of an overall power strategy rather than a source of surprises.

Frequently asked questions

Can I safely charge a portable power station from a car’s 12 V accessory socket while the engine is off?

Short, low-power top-ups from a 12 V socket can be done with the engine off, but prolonged charging risks draining the starter battery and shortening its life. For significant or long charging periods you should run the engine or use a dedicated auxiliary battery or DC–DC charger.

How long does charging a 1000 Wh power station from a car typically take?

Charging time depends on the actual charging power; with a realistic car socket delivery of about 100–120 W, a 1000 Wh station will take roughly 8–12 hours to charge due to conversion losses. Use the article’s formula (Wh ÷ W ÷ 0.85) to estimate other sizes and rates.

Will using an inverter plugged into the car to run the power station’s AC charger harm my vehicle?

Connecting an inverter adds conversion losses and concentrates load on the accessory socket, which can overheat plugs or blow fuses if you exceed the socket’s limits. It is acceptable when kept well below the socket and inverter ratings and with quality cabling, but monitor temperature and avoid continuous high loads.

Is hardwiring a dedicated DC line to the power station a good idea for faster charging?

Hardwiring can allow higher, safer continuous current if installed with the correct gauge wire, properly sized fuses, and secure connections, and it is often preferable for frequent high-power charging. However, incorrect installation can damage vehicle wiring or overload the alternator, so professional or experienced installation is recommended.

How can I avoid damaging the starter battery when charging a portable power station from my car?

Prefer charging while the engine is running, limit engine-off charging to short, low-power sessions, and monitor battery voltage or cranking performance. Consider installing a battery isolator or a DC–DC charger to protect the starter battery in regular off-grid use.

Idle Drain and “Phantom Loss”: Why Power Stations Lose Power When Not Used

Person cleaning a portable power station on a minimal tabletop

Portable power stations often lose a noticeable amount of charge even when nothing seems to be plugged in. This effect is commonly called idle drain or phantom loss. It describes any loss of stored energy while the unit is sitting unused, powered off, or on standby.

Some amount of idle drain is normal and unavoidable. However, excessive phantom loss can be frustrating, especially if you rely on a power station for emergencies, camping, or occasional backup use.

Understanding where this energy goes helps you store and use your power station more effectively, extend its battery lifespan, and avoid unpleasant surprises when you need power most.

What Is Idle Drain in a Portable Power Station?

Self-Discharge vs. Phantom Loss: Two Different Things

People often use “idle drain,” “phantom loss,” and “self-discharge” interchangeably, but they refer to slightly different processes.

Self-Discharge: Built-In Battery Chemistry Loss

Self-discharge is the gradual loss of charge that happens inside the battery cells themselves, even when completely disconnected from any device. It is a property of the battery chemistry.

Typical modern portable power stations use either:

  • Lithium-ion (NMC or similar) cells
  • Lithium iron phosphate (LiFePO4) cells

Approximate self-discharge rates under normal room-temperature storage:

  • Lithium-ion: Often around 1–3% per month
  • LiFePO4: Often around 1–2% per month

These are broad ranges; actual values depend on cell quality, age, and temperature. Self-discharge is relatively slow. If your power station is losing 10–20% in a week, the main culprit is usually not self-discharge alone.

Phantom Loss: Electronics That Never Fully Sleep

Phantom loss usually refers to the battery drain caused by electronic components in the power station, not the battery cells themselves. Even when you press the power button to turn the unit “off,” some internal circuits often remain active:

  • Battery management system (BMS)
  • Display controller
  • Standby power for inverters and DC/DC converters
  • Wireless modules or monitoring chips, if present

These background circuits may consume a small but continuous current, sometimes adding several percent of drain per week or more, depending on the design.

Where the Power Actually Goes When the Unit Is “Off”

Inside a portable power station, multiple systems can draw power even with no active load. How much they consume depends on hardware design and firmware behavior.

Battery Management System (BMS)

The BMS is always near the center of idle drain. It monitors and protects the battery pack by tracking:

  • Cell voltages
  • Current in and out
  • Temperature
  • Charge and discharge limits

Because safety is critical, the BMS rarely turns completely off. Instead, it usually enters a low-power state. Even then, it needs a trickle of energy to keep its microcontroller and sensing circuits alive.

Control Electronics and Display Circuits

Power stations include a main control board that handles buttons, modes, and often some kind of display. Depending on design, this circuitry can draw power even when the screen is dark, including:

  • Microcontroller or embedded processor
  • Real-time clock (to track time or logs)
  • Interface chips for USB ports and other connectors

In some models, the display backlight and processing logic enter a deeper sleep mode only after a timeout, so idle drain can be higher right after use and then drop later.

AC Inverter Standby Loss

The AC inverter converts battery DC to household-style AC. This is one of the most power-hungry components during active use. Even in standby, some inverters:

  • Keep parts of their circuitry energized for fast wake-up
  • Maintain internal reference voltages
  • Drive small control transformers or power supplies

If the AC output switch stays on, the inverter may continuously draw idle power even without anything plugged in. Turning the AC output off separately (if supported) usually reduces phantom loss significantly.

USB and DC Output Electronics

DC outputs such as USB-A, USB-C, 12 V car sockets, and barrel ports often have their own regulators or small converters. Many USB power-delivery controllers stay partially active to detect when a device is plugged in.

In some power stations, the DC section can be turned off independently from AC. If DC remains on, expect a low but non-zero standby draw from these circuits.

Wireless and Smart Features

Power stations with wireless or “smart” features may have extra always-on components, such as:

  • Bluetooth or Wi‑Fi chips
  • Low-power radios for remote monitoring
  • Logging or telemetry hardware

Even low-power wireless modules consume some energy to broadcast or listen for connections, contributing to phantom loss when left enabled.

How Temperature and Storage Conditions Affect Idle Drain

Environment plays a major role in how quickly a stored power station loses charge.

High Temperatures Increase Self-Discharge

Heat accelerates chemical reactions in batteries. At elevated temperatures:

  • Self-discharge of the cells increases
  • Electronics become less efficient
  • Long-term battery aging speeds up

Leaving a power station in a hot car, attic, or direct sun can noticeably increase idle drain. It also shortens overall battery lifespan over time.

Cold Temperatures Slow the Battery but Stress It

Cold environments tend to reduce self-discharge rates, but they also:

  • Increase internal resistance, reducing available output
  • Can interfere with accurate state-of-charge (SOC) readings
  • May cause BMS protections to limit charging or discharging

In very cold conditions, idle drain might appear smaller because capacity is temporarily less accessible. Once the unit warms up, the SOC reading can change unexpectedly.

State of Charge During Storage

The SOC at which you store the battery influences both idle drain behavior and long-term health:

  • Storing at 100% for long periods can raise aging and degradation, especially in warm conditions.
  • Storing near 0% risks the battery dropping too low from idle drain, potentially triggering BMS cutoff or damaging cells if left too long.
  • Many manufacturers recommend a 40–60% charge level for long-term storage.

How Much Idle Drain Is Normal?

Each model behaves differently, but you can use general ranges as a reference. Assuming a healthy battery stored at room temperature with outputs turned off:

  • A few percent per month: Typical for self-discharge plus very low-power electronics.
  • 5–10% per month: Common for many power stations with moderate standby systems.
  • More than 10% per week: Often indicates AC or DC outputs left on, active wireless, or a design with relatively high electronic standby draw.

Frequent fluctuations or rapid drops may also reflect inaccurate SOC calibration rather than pure energy loss. The BMS estimates remaining charge, and its calculation can drift over time.

How to Measure Idle Drain on Your Own Unit

You can perform a simple at-home test to understand your power station’s phantom loss.

Step-by-Step Idle Drain Test

  1. Charge the power station to a known SOC, for example 80% or 100%.
  2. Turn all outputs off (AC, DC, USB) and ensure no devices are connected.
  3. Note the exact time and SOC shown on the display.
  4. Store the unit at room temperature, away from heat or direct sun.
  5. Leave it untouched for a specific period, such as 7 days.
  6. After the period, power it on (if needed) and record the new SOC.

From this, you can estimate the weekly idle drain. For example, if SOC went from 90% to 85% over a week, idle drain is about 5% per week under those conditions.

Testing the Impact of Individual Features

You can repeat the test while intentionally leaving certain features on to see how much extra they add:

  • AC output on vs. off
  • USB section on vs. off
  • Wireless or app connectivity enabled vs. disabled

This helps identify which functions contribute most to phantom loss on your particular model.

Common Situations That Increase Phantom Loss

Certain everyday habits make idle drain worse without being obvious.

Leaving Outputs Switched On

For many units, the largest controllable contributor to idle drain is leaving AC or DC sections switched on between uses. Symptoms include:

  • Battery dropping overnight even with no loads plugged in
  • Noticeable drain during short storage (a few days)

Turning off each output mode when you are done using it usually reduces phantom loss significantly.

Always-Connected Chargers and Adapters

Even small devices or adapters can draw a trickle continuously, such as:

  • USB wall-style chargers left plugged into the AC outlets
  • 12 V adapters or extension cables
  • Smart devices that stay in standby mode

These loads may be easy to forget, but they count as constant drains. Physically unplugging them when storing the power station helps reduce loss.

Background Wireless Features

If your model supports app control, remote monitoring, or wireless updates, these features may keep radio modules running. Depending on design, phantom loss can increase when:

  • Bluetooth or Wi‑Fi stays enabled by default
  • The unit searches for connections even while otherwise idle

Check your settings; disabling wireless features when not needed can lower standby consumption.

Frequent Waking to Check the Display

Turning the display on repeatedly during storage spins up components that might otherwise stay in deep sleep. Over many days, this can add measurable extra drain.

Checking charge occasionally is good practice, but constant status checks out of curiosity can subtly increase loss.

Is Idle Drain Damaging to the Battery?

Idle drain itself is not inherently harmful. However, what it does to the state of charge over time can be.

Risk of Deep Discharge During Long Storage

If you store a power station nearly empty and leave it for months, idle drain can push the cells below the safe voltage range. The BMS may then:

  • Shut the system down to prevent damage
  • Refuse to start charging until revived carefully
  • In severe cases, be unable to recover all capacity

Repeated or prolonged deep discharge shortens battery life and can make the pack unstable or unusable.

High SOC Plus Heat Accelerates Aging

Keeping a battery at full charge for long periods, especially in warm conditions, increases internal stress. If idle drain is low but you habitually store the unit at 100% in a hot environment, the battery can still age faster.

Balancing SOC and temperature is more important for longevity than minimizing every last bit of phantom loss.

Practical Ways to Reduce Idle Drain

While some phantom loss is built-in, simple habits can keep it under control.

Turn Off Outputs After Use

After each session:

  • Switch off the AC output
  • Switch off DC/USB outputs if your unit has separate controls
  • Unplug any adapters or chargers left connected

This single habit often makes the biggest difference for most users.

Use Storage Mode or Deep Sleep Features

Some power stations offer:

  • A dedicated storage mode that lowers SOC and enters deeper sleep
  • Automatic shutdown after a period of low or no load
  • Settings to disable wireless functions or limit background activity

Consult your manual to see if your model includes such features and how to activate them before long-term storage.

Store at a Moderate State of Charge

For storage longer than a few weeks:

  • Aim for around 40–60% SOC before storing.
  • If your unit allows, set a custom target charge level instead of always topping to 100%.
  • Schedule periodic top-ups to keep SOC within a safe band.

Keep It in a Cool, Dry, Shaded Place

For everyday and seasonal storage:

  • Avoid direct sunlight and hot closed spaces (car trunks, attics).
  • Keep away from sources of moisture and condensation.
  • Room temperature environments typically offer the best balance.

Check and Recharge Periodically

Long-term storage still requires occasional attention. Many manufacturers recommend:

  • Checking SOC every 1–3 months.
  • Recharging back to the recommended storage range when it falls too low.

This prevents the battery from drifting into dangerously low charge levels due to slow, cumulative idle drain.

When Phantom Loss Seems Abnormally High

Sometimes idle drain is much higher than expected even after you follow best practices. Signs of a potential issue include:

  • Loss of 20% or more in just a couple of days with all outputs off
  • Battery dropping to zero during a short period of non-use
  • Rapid SOC swings that do not match actual usage

Possible Causes

Unusual phantom loss can result from:

  • Aging batteries with reduced capacity and unstable voltage behavior
  • Firmware bugs that keep circuitry awake unnecessarily
  • Defective BMS or inverter components drawing excess current
  • Hidden loads you forgot were plugged in

Basic Troubleshooting Steps

If you suspect a problem:

  • Disconnect everything from all ports.
  • Turn off AC and DC sections individually.
  • Disable wireless features, if possible.
  • Perform a fresh idle drain test over several days.

If drain remains high, check the manufacturer’s documentation for guidance on recalibrating SOC readings or updating firmware.

Key Takeaways About Idle Drain and Phantom Loss

Portable power stations cannot hold charge indefinitely. A combination of unavoidable self-discharge and always-on electronics gradually reduces stored energy, even in perfect storage conditions. By learning how your specific unit behaves, turning off unnecessary outputs, storing at moderate SOC, and maintaining a suitable environment, you can limit phantom loss and keep power available when you need it.

Frequently asked questions

How much charge will a portable power station typically lose per month when unused?

Typical idle drain ranges from a few percent per month for well-designed units with outputs off, up to 5–10% per month for models with moderate standby systems. Losses above about 10% per week usually indicate outputs left on, active wireless features, or a fault. Ambient temperature and battery age also materially affect these numbers.

Does pressing the power button fully stop portable power station idle drain?

No — the power button often places the unit into a low-power state but does not remove all standby currents. The BMS and some control electronics usually remain powered to protect the battery and track state-of-charge. Using a dedicated storage mode or turning individual outputs (AC/DC/USB) off will reduce phantom loss further.

What state of charge is best for storing a portable power station to minimize idle drain and aging?

For long-term storage, aim for roughly 40–60% state-of-charge, which balances reduced chemical stress and headroom against accidental deep discharge. Avoid storing at 100% in warm conditions or near 0% for long periods, both of which accelerate degradation or risk BMS cutoff. Check the unit’s manual for any manufacturer-specific storage recommendations.

Can wireless app connectivity significantly increase phantom loss?

Yes — Bluetooth or Wi‑Fi modules and remote monitoring radios can draw continuous current and noticeably increase idle drain when left enabled. Disabling wireless features when not needed or using a storage/deep-sleep mode can substantially lower standby consumption. The exact impact varies by model and radio design.

How do I test whether my unit has excessive idle drain?

Charge the unit to a known SOC, turn off all outputs and wireless features, record time and SOC, then store at room temperature and recheck after a fixed interval (for example 7 days). Compare the SOC change to the expected monthly/weekly ranges; repeat tests while enabling individual features to isolate contributors. If drain is unusually high, follow troubleshooting steps or contact support.

State of Charge (SOC) and Battery Calibration: Why Percent Readings Drift

Isometric illustration of portable power station and internal battery cells

Why State of Charge on Portable Power Stations Is Not Exact

The battery percentage on a portable power station looks simple: 100% means full, 0% means empty. In reality, that number is an estimate based on internal measurements and calculations. Over time, this estimate can drift, so the state of charge (SOC) reading no longer matches the true amount of energy in the battery.

Understanding why SOC drifts helps explain common questions, such as:

  • Why the display might drop from 100% to 90% quickly, then slow down
  • Why a unit may shut off even though it still shows 5–10% remaining
  • Why the same battery seems to last different amounts of time between charges

This article explains how SOC is estimated in modern lithium-ion and LiFePO4 portable power stations, why readings drift, and what battery calibration really means.

What State of Charge (SOC) Actually Means

State of charge is a way to express how full a battery is relative to its usable capacity.

In basic terms:

  • 100% SOC: the battery is at its allowed upper charge limit
  • 0% SOC: the battery has reached its allowed lower discharge limit
  • 50% SOC: about half of the usable capacity is available

Important details:

  • SOC refers to usable capacity, not the absolute chemical limits of the cells.
  • Battery management systems (BMS) keep a safety margin at the top and bottom to protect the cells.
  • The percentage you see is already shaped by those safety limits and internal assumptions.

SOC vs. State of Health (SOH)

SOC is often confused with state of health (SOH).

  • SOC: how full the battery is right now.
  • SOH: how much capacity the battery can store compared to when it was new.

As SOH declines with age, 100% SOC can represent less total energy than it did when the battery was new. SOC may still read accurately as a percentage, even though runtime is shorter.

How Portable Power Stations Estimate SOC

Modern portable power stations use a combination of methods to estimate SOC. None of these can measure the exact number of remaining watt-hours directly, so the BMS relies on models and assumptions.

Method 1: Voltage-Based Estimation

The most basic method uses battery voltage. A charged lithium-ion or LiFePO4 battery sits at a higher voltage than a discharged one. The BMS compares the measured voltage to an internal lookup table that maps voltage to SOC.

However, voltage is affected by many factors:

  • Load current: high loads cause voltage sag
  • Temperature: cold batteries show lower voltage
  • Cell chemistry: different chemistries have different voltage curves
  • Rest time: voltage recovers after the load is removed

LiFePO4 batteries in particular have a very flat voltage curve over much of their SOC range. That means a small change in voltage may correspond to a large change in SOC, which makes pure voltage-based estimation unreliable.

Method 2: Coulomb Counting (Current Integration)

To improve accuracy, many systems use coulomb counting. The BMS measures current going in and out of the battery and integrates it over time to track the net charge.

Conceptually:

  • When charging, the BMS adds amp-hours (Ah) to the internal counter.
  • When discharging, it subtracts amp-hours from the counter.
  • The counter is referenced to a known full or empty point to express SOC as a percentage.

Coulomb counting works well over short periods, but:

  • Measurement errors accumulate over time.
  • Actual usable capacity changes with temperature, age, and discharge rate.
  • Self-discharge during storage may not be perfectly tracked.

Method 3: Hybrid Algorithms and Battery Models

Most portable power stations use a hybrid approach that combines coulomb counting, voltage measurements, temperature sensing, and predefined battery models.

Typical behavior:

  • During active use, SOC follows coulomb counting, adjusted for efficiency losses.
  • When the battery rests, the system compares resting voltage to its model and may correct the SOC estimate.
  • At well-defined points, such as a controlled full charge or low-voltage shutdown, the BMS sets reference points for 100% or 0% SOC.

These internal models are designed around expected behavior of lithium-ion or LiFePO4 cells, but every real battery deviates slightly from the model. Over many cycles, these deviations cause SOC errors unless the system is periodically recalibrated.

Why SOC and Battery Percentage Drift Over Time

SOC drift is the gradual mismatch between the displayed percentage and the true remaining capacity of the battery. This is normal and expected for all batteries that rely on estimation.

1. Measurement and Rounding Errors Add Up

The BMS measures current, voltage, and temperature at discrete intervals. Each measurement is subject to:

  • Sensor accuracy limits
  • Rounding inside the microcontroller
  • Sampling delays, especially under rapidly changing loads

Over dozens of cycles, even small errors in coulomb counting accumulate, especially if the battery is rarely taken to clear reference points like a full charge.

2. Capacity Changes with Age and Use

As a lithium-ion or LiFePO4 battery ages, its total usable capacity gradually decreases. However, the BMS’s internal model may still assume a higher capacity unless the firmware adapts or is recalibrated.

This leads to issues such as:

  • Battery reaching low-voltage cutoff before the display hits 0%
  • Unexpectedly short runtime at low SOC
  • Power station shutting down earlier than the percentage suggests

3. Temperature Effects

Temperature has a major influence on both voltage and effective capacity:

  • Cold temperatures reduce available capacity and lower the voltage curve.
  • High temperatures can temporarily increase capacity but accelerate aging.

If the BMS uses temperature-compensated models, it may still not perfectly match the real behavior of the particular cells. SOC estimated at one temperature may not align well when conditions change.

4. Self-Discharge and Storage

When a portable power station sits unused, the battery slowly self-discharges. The BMS itself consumes a small standby current, and connected devices in low-power modes may draw additional energy.

If the system does not fully track these small, continuous currents, SOC may be overestimated after long storage periods. Users may see:

  • Display still showing a high percentage after weeks or months
  • Rapid drop in SOC once power draw resumes

5. Irregular Charge and Discharge Patterns

Many users operate their power stations in partial cycles: topping up from 40% to 80%, or discharging only from 100% to 60% repeatedly. While this can be gentle on the battery, it provides fewer clear reference points for the SOC algorithm.

Over time, this can cause:

  • SOC staying “stuck” around certain ranges
  • Percentage suddenly jumping after an unusually deep discharge or full charge
  • Mismatch between the displayed percentage and expected runtime from experience

What Battery Calibration Really Means

Battery calibration in the context of portable power stations is about calibrating the SOC estimate, not changing anything inside the cells.

Calibration aligns the BMS’s internal model with the actual behavior of the battery pack by providing clear reference points.

Common Calibration Steps in Practice

Although specific procedures vary, many systems benefit from a periodic controlled cycle:

  1. Charge to 100%
    Allow the unit to charge until it reaches a stable full state and remains there for a while (often 1–2 hours after first reaching 100%). This lets the BMS confirm its top-of-charge reference.
  2. Discharge under a moderate load
    Use the power station at a moderate, continuous load (not extremely high or extremely low) down to a low SOC level or until it shuts off normally. This helps the BMS observe the full discharge curve.
  3. Recharge fully without interruption
    After shutdown, recharge to 100% again in one session if possible. The full cycle gives the BMS data points to adjust its estimates.

Some devices have built-in learning algorithms that automatically refine SOC over time without a deliberate calibration cycle. Others benefit from an intentional recalibration if you notice persistent inaccuracies.

What Calibration Cannot Fix

Calibration cannot:

  • Restore lost capacity from aging or heavy use
  • Change the battery’s chemistry or safety limits
  • Override low-temperature or high-temperature protections

It only improves how well the displayed percentage matches the real usable energy under typical conditions.

How Drift Appears in Everyday Use

SOC drift often shows up as specific behaviors that users notice when running appliances or charging devices from a portable power station.

Nonlinear Percentage Drop

A common observation is that the first 10–20% seems to drop quickly, then the percentage appears to move slowly through the middle, and then may drop quickly again near the bottom.

This nonlinearity comes from:

  • The shape of the voltage curve for lithium-ion and LiFePO4 chemistries
  • How the SOC algorithm smooths or averages readings
  • Different loads at different times (for example, starting a high-wattage appliance briefly)

Even with perfect calibration, SOC will not always decrease at a steady rate because power draw and internal efficiency are not constant.

Early Shutdown with Percentage Remaining

Another common concern is a power station shutting down with 5–15% still showing on the display. This usually indicates that:

  • The battery has reached its low-voltage cutoff under the current load.
  • Actual capacity is lower than assumed, often from age or temperature.
  • The SOC algorithm has drifted and is overestimating remaining energy.

After cooling or resting, the battery’s voltage may recover, and the display might still show a nonzero percentage, even though the BMS will not allow further discharge.

Different Runtime at the Same SOC

Users may notice that 50% SOC sometimes powers a device for several hours, and other times only for a short period. Factors include:

  • Load level: high wattage draws reduce effective capacity due to internal resistance and heat.
  • Temperature: cold reduces usable capacity, especially for lithium-ion chemistries.
  • Recent usage: a heavily loaded battery may experience more voltage sag at the same SOC.

SOC is a snapshot of remaining charge, not a guarantee of runtime. Runtime always depends on power draw and conditions.

Best Practices to Keep SOC Readings Reasonably Accurate

Some drift is inevitable, but you can help your portable power station maintain more reliable SOC estimates through your usage patterns.

Occasionally Run a Full Calibration Cycle

If the manufacturer’s guidance allows it, consider:

  • Charging fully to 100% until the charger clearly stops
  • Discharging to a low percentage or automatic shutdown with a moderate, steady load
  • Recharging to 100% in one uninterrupted session

Doing this a few times per year can give the BMS better data to align its internal model with reality.

Avoid Extreme Temperatures During Critical Measurements

If you want the most reliable reading:

  • Charge and discharge near room temperature when possible.
  • Avoid calibrating in very cold or very hot environments.
  • Let a cold or hot unit rest indoors before relying on the SOC reading.

Store at Moderate SOC and Check Periodically

For storage:

  • Many lithium-ion and LiFePO4 batteries prefer storage around 30–60% SOC.
  • If left unused for months, expect SOC to be less accurate due to self-discharge and standby loads.
  • Periodically power the unit on and top it up if needed.

Long-term storage at 100% or near 0% SOC can increase degradation, which in turn complicates accurate SOC estimation as the battery’s capacity changes.

Understand That SOC Is an Estimate, Not a Fuel Gauge

Unlike a tank of liquid fuel, a battery’s energy content is not directly measurable with a simple sensor. Treat SOC as an educated estimate that:

  • Is very helpful for planning
  • Will never be mathematically perfect
  • Can shift slightly as the BMS refines its model

Key Takeaways for Portable Power Station Users

Portable power stations rely on complex algorithms to display state of charge. Lithium-ion and LiFePO4 batteries change over time with use, temperature, and age, so some drift in SOC is normal.

By recognizing that SOC is an estimate, occasionally allowing full charge and controlled discharge cycles, and operating within reasonable temperatures, you help the battery management system stay better calibrated. This leads to more predictable runtimes and fewer surprises, even as the battery naturally ages and its true capacity gradually declines.

Frequently asked questions

Why does my power station drop from 100% to 90% quickly?

That behavior is usually caused by how the SOC estimate is calculated: initial voltage and coulomb-counting corrections, rounding, and the battery model can make the top percentiles move faster. A brief voltage sag under load or the BMS applying efficiency corrections can make the displayed percentage fall quickly at first and then stabilize.

Why can the unit shut off while the display still shows 5–15% remaining?

The BMS enforces a low-voltage cutoff to protect cells, and under real load the battery can reach that cutoff before the SOC estimate reaches 0%. This can be due to capacity loss from age, temperature-related capacity reduction, or SOC drift that overestimates remaining energy.

How often should I run a calibration cycle to reduce SOC drift?

For most users, performing a full charge→controlled discharge→full recharge cycle a few times per year is sufficient, or whenever you notice persistent inaccuracies. Follow the manufacturer’s guidance and avoid extreme temperatures during calibration for the best results.

Can calibration restore lost battery capacity?

No — calibration only improves the accuracy of the SOC estimate by aligning the BMS model to observed full and empty points. It cannot reverse capacity loss caused by age, cycling, or cell degradation.

Does temperature make SOC readings unreliable?

Yes. Temperature changes affect cell voltage and usable capacity, so SOC estimated at one temperature may not match performance at another. Avoid calibrating in very hot or cold conditions and expect shorter runtimes in cold environments.

Battery Management System (BMS) Explained: Protections Inside a Power Station

Isometric illustration of battery cells inside module

What is a Battery Management System (BMS)?

A Battery Management System (BMS) is the electronic control and protection system that monitors and manages the cells inside a battery pack. In a portable power station the BMS is the central subsystem that keeps the battery operating safely, extends cell life, and enables reliable charging and discharging.

Why a BMS Matters in Portable Power Stations

Portable power stations combine one or more cell modules with an inverter, charger, and output circuitry. Cells are sensitive to voltage, current, temperature, and state of charge. The BMS ensures those conditions stay within safe limits.

Without an effective BMS, the battery pack risks reduced capacity, accelerated aging, thermal events, and sudden failure. The BMS is the primary safety layer to prevent those outcomes.

Core Protections Provided by a BMS

A modern BMS implements multiple overlapping protections. Each addresses a different risk to cells or to the user.

Overcharge Protection

Overcharging raises cell voltage beyond safe limits and can cause oxygen release, increased pressure, and permanent damage. The BMS monitors per-cell voltages and stops charging at a defined cutoff.

Overdischarge Protection

Deep discharge can damage cell chemistry and reduce usable capacity. The BMS blocks further discharge when cells reach a minimum safe voltage, protecting long-term health.

Overcurrent and Short-Circuit Protection

High discharge currents and short circuits generate heat and stress. The BMS detects excessive current and responds by opening switches, tripping contactors, or blowing fuses to interrupt flow.

Thermal Protection

Temperature affects performance and safety. The BMS uses temperature sensors to limit charge/discharge at extreme temperatures and to shut down the pack if temperatures exceed safe thresholds.

Cell Balancing

Individual cells in a pack drift apart in voltage over time. Balancing redistributes or bleeds off energy so cells remain matched, maximizing capacity and preventing weak cells from limiting the pack.

State Estimation and SoC Limits

The BMS estimates state of charge (SoC) and state of health (SoH) using voltage, current, and time-based algorithms. These estimates inform charge and discharge limits and user displays.

Isolation and Ground Fault Detection

Some BMS implementations check for isolation resistance and ground faults, particularly when the power station connects to external sources like solar panels or AC mains. This prevents hazardous leakage paths.

Communications and Diagnostics

Many BMSs expose telemetry to chargers, inverters, or a user interface. Communications enable coordinated control, fault logging, and firmware updates for improved performance and diagnostics.

How Protections Are Implemented

BMS designs combine sensors, power electronics, embedded software, and safety components. Key elements include:

  • Voltage sensing circuits that measure each cell or cell group.
  • Current sensors (shunts or hall-effect) for accurate charge and discharge monitoring.
  • Temperature sensors placed at cell groups or critical locations.
  • Switching devices such as MOSFETs or contactors to connect and disconnect the pack.
  • Passive or active balancing circuitry to equalize cell voltages.
  • Microcontrollers and firmware that execute protection logic and communications.
  • Hardware fuses or thermal fuses as last-resort fail-safes.

MOSFETs, Contactors, and Fuses

MOSFETs provide fast switching for charge/discharge control, while contactors or relays handle high-energy disconnects. Physical fuses provide irreversible protection in catastrophic events.

Passive vs Active Balancing

Passive balancing bleeds excess energy from high cells through resistors. It is simple and cost-effective. Active balancing transfers energy from higher cells to lower ones more efficiently, improving usable capacity especially on large packs.

Interaction with Charger and Inverter

The BMS must coordinate with the power station’s charger and inverter. Typical coordination tasks include:

  • Signaling when charging can occur and when to stop (charge enable/disable).
  • Limiting charger current based on pack temperature or cell imbalance.
  • Permitting inverter operation only when state of charge and cell conditions are safe.
  • Reporting faults and status to the user interface or remote monitoring system.

Monitoring, Logging, and Firmware

Logging events such as overcurrent trips, temperature excursions, and balancing activity is important for troubleshooting and warranty evaluation. Firmware implements algorithms for SoC/SoH estimation and must be validated to avoid erroneous shutdowns or missed faults.

Secure firmware update mechanisms are also important to fix bugs and improve algorithms over time.

Limitations and Failure Modes

A BMS reduces risk but does not eliminate it completely. Common limits and failure modes include:

  • Sensor failures giving false readings and inappropriate responses.
  • Firmware bugs that miscalculate SoC or miss fault conditions.
  • Physical damage to wiring or cells outside the BMS’s sensing area.
  • Component failures such as MOSFETs or current sensors failing short or open.
  • Environmental factors (water ingress, extreme mechanical shock) that bypass safeguards.

Robust designs use redundant sensors, watchdog timers, and hardware-level failsafes (fuses, thermal cutouts) to guard against single-point failures.

Standards and Testing

Battery packs and BMSs are typically designed to meet industry safety standards and undergo testing for abuse conditions, short circuits, thermal stability, and electrical isolation. Look for products that reference recognized standards and independent testing to ensure compliance.

Maintenance and Best Practices

Users can help a BMS keep the pack healthy by following some basic practices:

  • Store the power station at moderate state of charge (often 40–60%) if unused for long periods.
  • Avoid charging or discharging at extreme temperatures. Let the unit warm or cool before use if necessary.
  • Keep vents and cooling passages clean and unobstructed.
  • Update firmware when vendor-supplied updates are available, following official instructions.
  • Have cellular or battery pack service performed by trained technicians if the pack is damaged or shows repeated faults.

Common Misconceptions

Some users expect a BMS to be a cure-all. Clarify these points:

  • A BMS cannot prevent damage from physical puncture or severe mechanical abuse.
  • It cannot completely compensate for cells that are aged or defective; it can only limit operation to reduce risk.
  • Not all BMSs are equivalent—features and robustness vary by design and validation.

Frequently Asked Questions about BMS

How does the BMS detect a short circuit?

The BMS monitors current continuously. A sudden spike beyond configured thresholds triggers immediate disconnect through MOSFETs or contactors and may also blow a fuse if present.

Can the BMS be reset after a fault?

Some faults clear automatically when conditions return to normal; others require manual reset or service. Critical faults often need professional inspection before reuse.

Does cell chemistry change BMS settings?

Yes. Different chemistries (for example lithium ion versus LiFePO4) have different voltage and temperature ranges, and the BMS must be configured accordingly.

Further Reading

For technical users, topics to explore next include cell balancing algorithms, SoC estimation methods (Coulomb counting and model-based approaches), and standards for battery safety testing.

The BMS is a critical component inside any portable power station. Understanding its protections and limitations helps owners use and maintain their equipment safely and effectively.

Frequently asked questions

How does cell balancing extend the life and usable capacity of a battery pack?

Cell balancing keeps individual cells at similar state-of-charge so that no single cell reaches overcharge or deep-discharge limits before the pack as a whole. By preventing cells from hitting extreme voltages repeatedly, balancing reduces stress and uneven aging, which helps preserve usable capacity and cycle life. Active balancing is more efficient for large packs, while passive balancing is simpler and commonly used in smaller systems.

Can a BMS completely prevent thermal runaway in a battery pack?

No. A BMS significantly reduces the probability of thermal runaway by limiting charge/discharge, monitoring temperature, and shutting down the pack on unsafe conditions, and hardware safeguards (fuses, contactors) act as additional layers. However, it cannot guarantee prevention in cases of severe mechanical damage, manufacturing defects, or external abuse that bypass electronic controls.

What steps should I take if the BMS reports repeated overcurrent or cell imbalance faults?

Stop charging or discharging the pack and disconnect external loads if it is safe to do so. Inspect for obvious issues such as damaged cables, loose connections, or blocked cooling; check for firmware updates and review fault logs, and if the problem persists, have the pack inspected and serviced by trained technicians.

How does the BMS communicate charge and discharge limits to the charger or inverter?

The BMS typically communicates via digital buses (for example CAN or SMBus/I2C) or through dedicated enable/limit signals and telemetry lines. It reports parameters such as SoC, temperature, cell imbalances, and fault states so upstream chargers or inverters can adjust current, stop charging, or refuse to run until conditions are safe.

How often should BMS firmware and diagnostic logs be checked or updated?

Review diagnostic logs whenever a fault occurs and include a firmware/log check in routine maintenance; for many consumer units an annual inspection is reasonable, while critical installations may require more frequent reviews. Apply vendor-supplied firmware updates when they address safety fixes or documented reliability improvements, following the manufacturer’s instructions.

Battery Cycle Life Explained: What “Cycles” Really Mean

isometric illustration of battery cells inside portable power station

What Battery Cycle Life Really Means

When you shop for a portable power station, you will often see specifications like ‘3,000 cycles to 80%’ or ‘500 cycles to 70%’. These numbers are describing battery cycle life, one of the most important factors in how long your power station will remain useful.

Understanding what a ‘cycle’ is, how it is measured, and what those percentages mean will help you estimate long-term value, choose the right chemistry, and take care of your battery.

What Is a Battery Cycle?

A battery cycle is a complete use of energy equal to 100% of the battery’s rated capacity, followed by recharging. It is not necessarily one full discharge from 100% down to 0% in a single event.

Full cycles vs partial cycles

In practical use, you may rarely drain a portable power station from full to empty in one go. Instead, you might:

  • Discharge from 100% down to 60% one day (40% used)
  • Recharge to 100%
  • Discharge from 100% down to 60% again the next day (another 40% used)

Those two partial discharges (40% + 40% = 80%) plus another small discharge later would together count as roughly one full cycle. Battery cycle counting is based on the total energy moved in and out, not how many times you press the power button.

Depth of discharge (DoD)

Cycle life is closely tied to depth of discharge (DoD), which is how much of the battery’s capacity you use in each cycle.

  • 100% DoD: using the full capacity (for example, 100% down to near 0%)
  • 50% DoD: using half the capacity (for example, 100% down to 50%)
  • 20% DoD: shallow cycling (for example, 80% down to 60%)

In general, the shallower each cycle (lower DoD), the more total cycles the battery can deliver over its life.

How Manufacturers Define Cycle Life

Cycle life numbers in technical specifications are not guesses; they come from standardized test procedures performed under controlled conditions. However, real-world use often differs from the lab.

Typical cycle life specification format

Most data sheets express cycle life in a format similar to:

  • ‘X cycles to Y% capacity’

For example:

  • ‘500 cycles to 80% capacity’
  • ‘3,000 cycles to 80% capacity’

This means that after the stated number of cycles, the battery is expected to retain the given percentage of its original capacity, not that it will suddenly stop working.

End-of-life capacity threshold

Cycle life is usually defined up to an end-of-life (EOL) capacity threshold. Common thresholds are:

  • 80% of original capacity (most common)
  • 70% or sometimes 60% for certain applications

So if a battery starts with 1,000 Wh of usable capacity and is rated for 2,000 cycles to 80%, then at around 2,000 cycles it is expected to hold about 800 Wh. It may still operate for many more cycles, but with reduced runtime.

Standard test conditions

Cycle life testing is typically done with:

  • Controlled temperature (often around 25°C / 77°F)
  • Controlled charge and discharge currents (C-rate)
  • Fixed depth of discharge (for example, 100% or 80% DoD)

Manufacturers follow various international standards or internal protocols. In the field, portable power stations will face different temperatures, different power draws, and irregular use patterns, so actual cycle life can be higher or lower than the lab rating.

Cycle Life and Battery Chemistries

Portable power stations commonly use two broad categories of lithium-based batteries. Each has different typical cycle life characteristics.

Lithium-ion (NMC and similar)

Many compact or lightweight models use lithium-ion chemistries such as nickel manganese cobalt (NMC) or related blends.

Typical characteristics:

  • Energy density: higher, meaning more capacity for a given weight and size
  • Typical rated cycle life: often a few hundred to around 1,000 cycles to 80% under standard conditions
  • Sensitivity: more affected by high temperatures and deep discharges

Lithium iron phosphate (LiFePO4)

Many newer portable power stations use lithium iron phosphate (LiFePO4) cells.

Typical characteristics:

  • Energy density: lower than many other lithium-ion types, so units can be heavier
  • Typical rated cycle life: often in the thousands of cycles to 80% under standard conditions
  • Robustness: generally more tolerant of frequent cycling and higher temperatures

The exact numbers depend on cell quality, design, and how conservative the manufacturer is in its rating. Still, as a broad trend, LiFePO4 is associated with longer cycle life, while other lithium-ion chemistries tend to offer higher energy density.

How Cycle Life Affects Portable Power Station Lifespan

Cycle life is one of the main determinants of how long a portable power station will deliver useful runtime. The more often you cycle the battery and the deeper you discharge it, the faster capacity will decline.

High-use vs occasional-use scenarios

Consider two different usage patterns:

  • Daily use: running tools, appliances, or devices every day, for example during off-grid living or full-time vanlife
  • Occasional use: backup for power outages or weekend camping

A battery rated for 3,000 cycles to 80% could look very different in these scenarios:

  • At one cycle per day: 3,000 cycles is roughly 8+ years to reach 80% capacity
  • At one cycle per week: 3,000 cycles would span many decades, but calendar aging will limit practical life before that

For occasional emergency backup use, calendar aging (years of existence) can dominate over the cycle count. For intensive daily use, cycle life becomes the critical factor.

Calendar life vs cycle life

Batteries age in two main ways:

  • Cycle aging: capacity loss from charging and discharging
  • Calendar aging: capacity loss over time, even with minimal use

Calendar aging is influenced by:

  • Average state of charge (keeping batteries full or near empty for long periods)
  • Ambient temperature during storage
  • Time since manufacture

Portable power station manufacturers sometimes mention both cycle life and an expected calendar life (for example, certain capacity retained after a number of years). Both should be considered, especially for backup-only use.

What Actually Counts as a Cycle in Real Use

Cycle counting in a portable power station’s battery management system (BMS) is not always visible to the user, but the principle is the same: it tracks the amount of energy that flows in and out.

Example of multiple small discharges

Imagine the following usage pattern on a 1,000 Wh portable power station:

  • Morning: use 100 Wh to power a laptop
  • Afternoon: use 200 Wh for tools
  • Evening: use 300 Wh for lighting and a fan

Total discharge for the day: 600 Wh.

If you then recharge back to 100%, you have completed about 0.6 of a cycle (600 Wh out of 1,000 Wh). Over several days, the BMS will add these partial cycles together to estimate total cycle count.

Does turning the unit on and off matter?

Turning your portable power station on or off does not create cycles by itself. Cycles are all about energy throughput, not power button presses. However, devices that draw power in standby mode will still slowly discharge the battery, contributing to cycle usage over time.

Factors That Reduce or Extend Cycle Life

Cycle life ratings assume controlled conditions. Real-world conditions can either shorten or extend actual cycle life.

Factors that reduce cycle life

  • High temperatures: storing or operating the unit in hot environments accelerates chemical degradation
  • Very deep discharges: frequent discharges close to 0% state of charge (SoC) stress cells more
  • Staying at 100% for long periods: long-term storage or parking at full charge can increase calendar aging
  • High charge/discharge rates: repeatedly pushing the maximum output or fastest charging modes can increase wear

Factors that support longer cycle life

  • Moderate temperatures: storing and operating around room temperature is ideal
  • Moderate depth of discharge: cycling between, for example, 20–80% or 10–90% instead of 0–100% every time
  • Avoiding constant full charge storage: storing long term around 30–60% SoC when not in use (if supported by the device)
  • Smooth load profiles: using the unit within its comfortable continuous power range rather than near peak capacity

Cycle Life and Portable Power Station Sizing

Understanding cycle life can also inform how you size a portable power station for your needs. Choosing capacity that is too small may mean you push the battery to deeper discharges more often.

Using a larger battery for shallow cycling

If your daily energy needs are close to the full capacity of a small power station, you will routinely cycle at high depth of discharge. A larger-capacity unit lets you use the same amount of energy while cycling more shallowly.

Example:

  • Daily usage: 500 Wh
  • 1,000 Wh power station: about 50% DoD per day
  • 600 Wh power station: about 83% DoD per day

The unit with larger capacity will experience less stress per cycle, potentially extending its usable lifespan, even though both deliver the same daily energy.

Balancing weight, cost, and cycle life

Higher-capacity and longer-cycle-life batteries generally weigh more and cost more. Finding the right balance depends on:

  • How frequently you plan to use the power station
  • Whether it is for mobile use (where weight and size matter)
  • How many years of heavy service you expect

For rare emergency use, extreme cycle life might be less crucial. For daily off-grid power, high cycle life can be a key selection criterion.

How To Read Cycle Life Specs When Comparing Models

Not all cycle life claims are presented the same way. Paying attention to the details helps you compare models more accurately.

Key points to look for

  • End-of-life percentage: Is the rating to 80% capacity, 70%, or something else?
  • Number of cycles: How many cycles are claimed under that EOL definition?
  • Test conditions (if provided): Temperature, depth of discharge, and C-rates used for testing
  • Battery chemistry: Whether the unit uses LiFePO4 or another lithium-ion chemistry

Realistic expectations vs marketing numbers

Cycle life ratings are not a guarantee that at exactly that cycle count the battery will suddenly drop to the specified capacity. Instead, they are a benchmark based on standardized tests.

In real use:

  • Some units will retain more capacity than the spec suggests
  • Others may wear faster if operated in harsher conditions
  • Capacity generally declines gradually, not all at once

Practical Tips To Maximize Cycle Life

While you cannot stop battery aging, you can influence the rate with a few simple habits.

Storage and environment

  • Store the power station in a cool, dry place away from direct sunlight
  • Avoid leaving it inside hot vehicles or unventilated spaces
  • For long-term storage, aim for a moderate state of charge if the manual recommends it

Charging and discharging habits

  • Use recommended chargers and input settings provided by the manufacturer
  • Avoid running the battery to absolute empty whenever possible
  • Try not to leave the unit at 100% for months if it is not being used
  • Stay within the continuous power rating rather than near peak output for long periods

Routine checks

  • Turn the unit on periodically during long storage periods to check state of charge
  • Top up the battery as needed to prevent very low SoC over months
  • Follow any specific maintenance or firmware update guidance from the manufacturer

Why Cycle Life Matters in a Portable Power Station

Understanding battery cycle life helps you answer practical questions about a portable power station:

  • How many years of daily use can I expect before capacity noticeably drops?
  • Is this model better suited for occasional emergency backup or heavy routine use?
  • Does the battery chemistry align with my needs for longevity, weight, and size?

By looking beyond marketing phrases and examining cycle life specifications, chemistry type, and test assumptions, you can select and use a portable power station in a way that aligns with how often you plan to rely on it and how long you want it to last.

Frequently asked questions

How does depth of discharge (DoD) affect battery cycle life?

Depth of discharge significantly impacts cycle life: deeper discharges generally cause more wear per cycle than shallow discharges, so using a lower DoD typically yields more total cycles over the battery’s life. Manufacturers often specify cycle life at a fixed DoD (for example, 80% or 100%), so compare ratings that use the same DoD to get an accurate sense of longevity.

What typical cycle life can I expect from LiFePO4 compared with other lithium-ion chemistries?

LiFePO4 cells commonly offer thousands of cycles to a specified end-of-life threshold (often 80% capacity), whereas other lithium-ion chemistries like NMC typically offer several hundred to around a thousand cycles under similar test conditions. Actual numbers vary with cell quality, testing parameters, and real-world operating conditions such as temperature and charge rates.

Does storing a battery at 100% state of charge shorten its cycle life?

Yes — long-term storage at or near 100% state of charge accelerates calendar aging for many lithium-based batteries and can reduce effective cycle life over time. When storing a unit for extended periods, follow the manufacturer’s recommendation (often around 30–60% SoC) and store in a cool, dry environment.

How much does temperature affect battery cycle life in portable power stations?

Temperature has a large effect: high temperatures accelerate chemical degradation and reduce both cycle life and calendar life, while very low temperatures can temporarily reduce usable capacity and increase stress during charging. Operating and storing the battery near room temperature generally provides the best balance of performance and longevity.

Can charging behavior, like fast charging or staying at full charge, change the battery’s cycle life?

High charge and discharge rates (fast charging or sustained high power draw) and prolonged periods at full charge tend to increase wear and can shorten cycle life; avoiding repeated maximum-rate charging and not leaving the battery at 100% for long periods can help preserve capacity. Use the manufacturer’s recommended charging settings and avoid routinely operating at the battery’s limits when longevity is a priority.