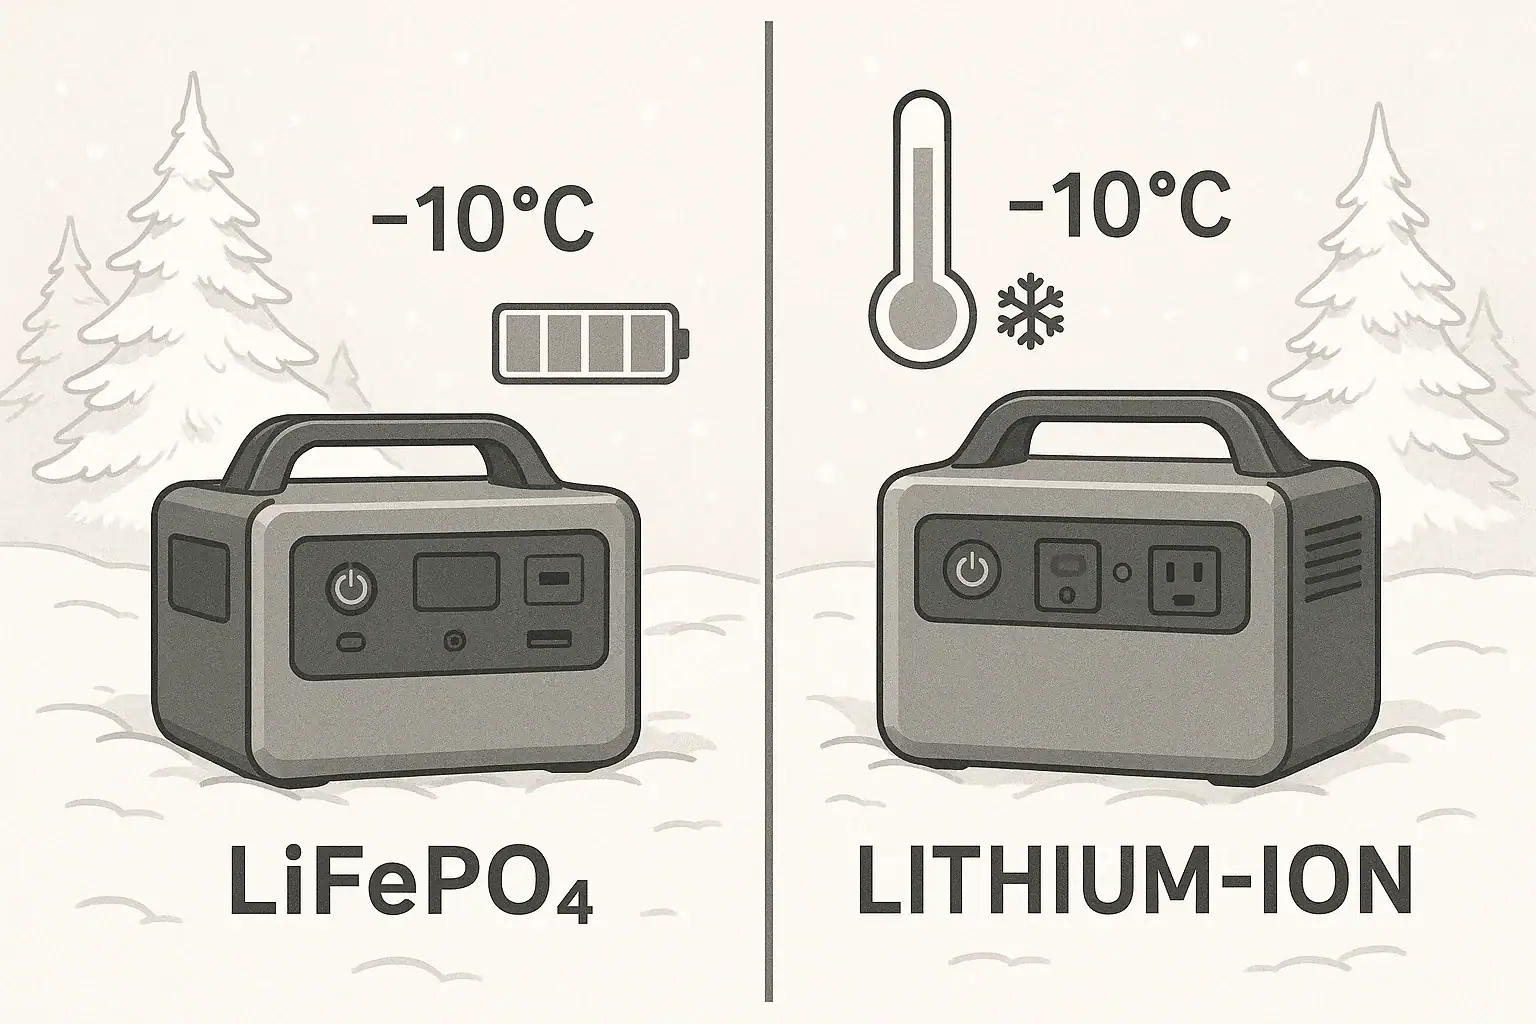
In cold weather, LiFePO4 batteries usually hold voltage more steadily but lose usable capacity faster, while other lithium-ion chemistries can deliver more power at very low temperatures but degrade quicker over time. For portable power stations, this affects runtime, charging speed, and whether your unit will even start in freezing conditions. People search for answers using terms like battery runtime, low temperature limit, cold crank behavior, depth of discharge, and cycle life.
Understanding how LiFePO4 vs lithium-ion react to the cold helps you avoid dead power stations, failed starts, and permanent battery damage. The right chemistry and settings can mean the difference between a reliable winter backup and a brick when you most need it. This guide explains what happens inside the cells, how it shows up in real-world use, and which specs matter most when you compare portable power stations for winter camping, off-grid cabins, or emergency backup.
LiFePO4 vs lithium-ion: what they are and why cold weather matters
Both LiFePO4 and lithium-ion are rechargeable lithium-based batteries, but they use different cathode materials and behave differently in cold weather. “Lithium-ion” is a broad term that usually refers to chemistries like NMC (nickel manganese cobalt) or NCA (nickel cobalt aluminum), while LiFePO4 uses lithium iron phosphate.
For portable power stations, the chemistry you choose affects three core cold-weather outcomes: whether the battery will accept a charge, how much runtime you get, and how long the battery will last over years of use. Temperature directly changes internal resistance, voltage sag, and how quickly the cells age.
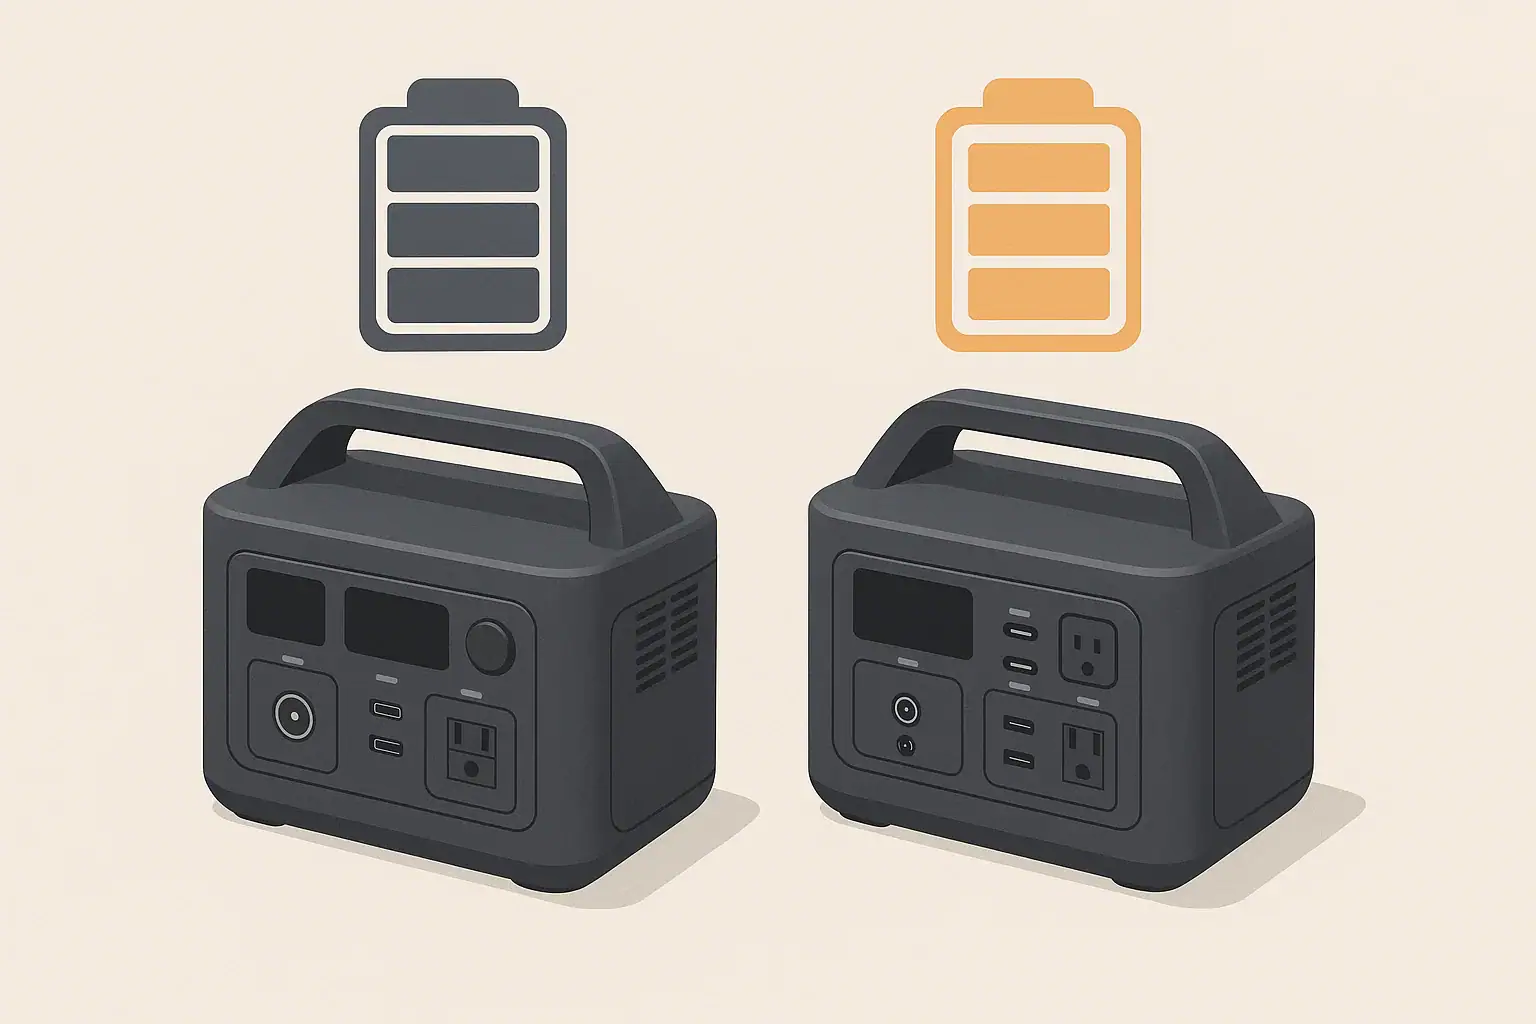
In moderate cold (around 32°F / 0°C), LiFePO4 typically offers excellent cycle life and stable voltage but reduced usable capacity. In deeper cold (well below freezing), many lithium-ion chemistries may still deliver bursts of power but can suffer faster long-term degradation and higher risk if charged outside their safe limits.
Because portable power stations are often used for backup power, winter camping, tailgating, or in unheated garages, understanding the differences between LiFePO4 and lithium-ion in the cold helps you pick a system that will actually work when temperatures drop.
How cold affects LiFePO4 and lithium-ion batteries inside a portable power station
Cold weather changes how ions move inside the battery. As temperature drops, the electrolyte becomes less conductive, and the chemical reactions that move lithium ions between anode and cathode slow down. This affects LiFePO4 and other lithium-ion chemistries in slightly different ways.
Internal resistance and voltage sag
At low temperatures, internal resistance increases. That means:
- More voltage sag under load (the voltage drops more when you turn on a device).
- Reduced peak power output (inverter may shut down earlier on high-watt loads).
- Lower apparent capacity (the battery reaches its cutoff voltage sooner).
LiFePO4 already has relatively high internal resistance compared to some lithium-ion chemistries at room temperature, and this difference becomes more noticeable in the cold. The result is that a LiFePO4 pack might hit its low-voltage cutoff earlier under the same load, even if the actual stored energy is similar.
Charge acceptance and low-temperature charging limits
Charging is more sensitive to cold than discharging. Both LiFePO4 and other lithium-ion batteries can be damaged if charged too quickly when cold, especially below freezing. Lithium plating can occur on the anode, leading to permanent capacity loss and safety risks.
Typical behavior in a portable power station:
- Above about 32°F (0°C): Most systems allow normal charge current, though with slightly reduced efficiency.
- Between roughly 14°F and 32°F (-10°C to 0°C): Many battery management systems (BMS) will reduce charge current or switch to a slow charge profile.
- Below about 14°F (-10°C): Many BMS designs will block charging entirely to prevent damage.
LiFePO4 is particularly sensitive to charging below freezing, so well-designed systems rely heavily on BMS protections or internal heaters to manage cold charging. Other lithium-ion chemistries may tolerate slightly lower charge temperatures, but repeated cold charging still accelerates wear.
Capacity loss and runtime in the cold
All lithium-based batteries show apparent capacity loss in cold weather because the reactions slow down and internal resistance rises. A pack rated for 100% capacity at 77°F (25°C) might only deliver 60–80% at 14°F (-10°C), depending on chemistry and discharge rate.
LiFePO4 tends to show more noticeable capacity loss at low temperatures compared with some NMC/NCA lithium-ion cells, especially at higher discharge rates. However, LiFePO4 also tends to recover more of its capacity when warmed back up, and its long-term cycle life remains strong if it has been protected from cold charging.
BMS behavior and cold-weather protections
The battery management system is the gatekeeper. In modern portable power stations, the BMS monitors cell temperature, voltage, and current, and it may:
- Block charging below a set temperature.
- Limit discharge current when cells are cold.
- Shut the system down if temperature falls outside safe bounds.
- Coordinate with internal heaters to raise battery temperature before charging.
Some LiFePO4-based systems include active self-heating, allowing the pack to warm itself using a portion of the incoming charge, then resume full charging once safe. Many basic lithium-ion systems rely solely on passive temperature limits and may simply refuse to charge in deep cold.
| Parameter | LiFePO4 | Typical lithium-ion (NMC/NCA) |
|---|---|---|
| Nominal cell voltage | ~3.2 V | ~3.6–3.7 V |
| Relative capacity at 32°F (0°C) | ~75–85% | ~80–90% |
| Relative capacity at 14°F (-10°C) | ~55–75% | ~60–80% |
| Cold charge tolerance | More sensitive; strict BMS limits common | Slightly more tolerant but still limited |
| Cycle life (moderate temps) | Often higher | Often lower |
| Voltage stability under load | Very stable until cutoff | More gradual sag |
Real-world cold-weather scenarios for LiFePO4 and lithium-ion power stations
Understanding lab behavior is useful, but what matters is how your portable power station performs at a campsite, in a vehicle, or during a winter outage. Here are common scenarios that highlight the differences between LiFePO4 and other lithium-ion chemistries in the cold.
Winter camping at freezing temperatures
Imagine an overnight trip where temperatures drop to around 32°F (0°C). You use a portable power station to run LED lights, charge phones, and power a small DC fridge.
- LiFePO4 unit: You may see a noticeable drop in displayed remaining capacity overnight, and the fridge might trigger low-voltage cutoffs sooner when the compressor starts. However, the battery voltage remains relatively flat until near the end, making runtime somewhat predictable.
- Lithium-ion unit: You may get slightly longer runtime at the same temperature and loads, with a bit more tolerance to short compressor surges. The trade-off is that repeated deep discharges and cold use can shorten long-term cycle life more than with LiFePO4.
Vehicle-based power in sub-freezing weather
Consider a power station left in a car overnight at 14°F (-10°C), then used to power a tire inflator and charge a laptop in the morning.
- Start-up behavior: Some LiFePO4-based units may initially refuse to charge from the vehicle outlet until the internal pack warms up. Discharge may still be allowed but at reduced current.
- Load handling: A high-draw device like a tire inflator can cause voltage sag. A LiFePO4 pack might hit low-voltage cutoff faster under that surge compared with certain lithium-ion packs, even if its rated capacity is similar.
- Recovery: Once the cabin warms or the unit is brought indoors, both chemistries recover much of their apparent capacity, but the LiFePO4 may show less long-term wear if it has not been charged while still very cold.
Unheated garage or shed backup power
For backup use in an unheated garage, the power station might sit idle for weeks in temperatures hovering around or below freezing, then be expected to run tools or a sump pump during an outage.
- LiFePO4 advantages: Very low self-discharge, long cycle life, and good calendar life mean it is more likely to retain its rated capacity over years of standby.
- LiFePO4 limitations: If an outage occurs while the pack is very cold, initial peak power and usable capacity may be lower than expected, especially for heavy loads.
- Lithium-ion behavior: It may deliver higher peak power in the cold but could lose capacity faster over years of storage and use, especially if regularly charged to 100% and stored hot in summer months.
Emergency indoor heating or electronics during a winter outage
During a multi-day winter outage, you might use a power station to run a low-wattage space heater (within inverter limits), communication devices, or a router.
- Temperature moderation: Indoors, the temperature is usually less extreme, so both chemistries perform closer to their rated specs.
- LiFePO4 benefit: The strong cycle life shines when you perform multiple deep discharges in a short period. You are less likely to notice permanent capacity loss after the event.
- Lithium-ion consideration: The unit may work well during the event but can lose usable capacity more quickly over multiple seasons of similar use, particularly if often charged to 100% and stored at high state of charge.
Common cold-weather mistakes and troubleshooting signs
Many cold-weather battery problems come from using or charging portable power stations outside their recommended temperature range. Recognizing the symptoms can help you avoid permanent damage.
Trying to fast charge below freezing
One of the biggest mistakes is forcing a fast charge when the battery is below 32°F (0°C), especially for LiFePO4. Symptoms include:
- Charging suddenly stops or never starts, even though AC or solar input is present.
- Charge rate is much lower than usual (for example, only a fraction of the normal wattage).
- Error icons or temperature warnings on the display.
These are often protective actions by the BMS. If you bypass them using external chargers or workarounds, you risk lithium plating and permanent capacity loss. The correct response is to bring the unit into a warmer environment and allow it to reach a safe temperature before charging.
Expecting summer runtime in winter conditions
Another common issue is assuming the same runtime in winter as in summer. Signs of cold-related capacity loss include:
- Battery percentage dropping faster than expected under familiar loads.
- Inverter shutting off early when starting a compressor, pump, or heater fan.
- DC outputs cutting out while the display still shows significant charge remaining.
This is usually not a defect but a combination of increased internal resistance and low-temperature voltage behavior. LiFePO4 in particular may hit its low-voltage cutoff quickly under high loads in the cold, even when the state of charge is not truly near zero.
Leaving the unit fully depleted in the cold
Storing a power station at very low state of charge in cold conditions can cause issues for both LiFePO4 and lithium-ion chemistries. Warning signs include:
- Unit will not turn on after long storage.
- Battery percentage reads 0% and does not rise even when plugged in immediately.
- Display flickers or resets when you try to start a load.
Some BMS designs enter a deep sleep mode to protect the cells when voltage is very low. Recovery may still be possible by leaving the unit on charge for an extended period in a warm environment, but repeated deep storage depletion shortens lifespan for any lithium-based battery.
Ignoring BMS temperature warnings
If the display shows a temperature or battery warning, do not keep trying to restart or override it. Repeated resets can stress the cells and internal electronics. Instead:
- Move the power station to a moderate-temperature area.
- Let it sit unplugged for a while so internal temperature equalizes.
- Try a low-power load or a gentle charge source first to confirm stable operation.
If warnings persist at normal room temperature, contact the manufacturer or a qualified technician, as the issue may be more than just cold-weather behavior.
Cold-weather safety basics for LiFePO4 and lithium-ion power stations
Safety in cold weather is mostly about preventing charging damage and avoiding unsafe workarounds. While both LiFePO4 and other lithium-ion chemistries can be very safe when managed correctly, cold conditions increase the risk of misuse.
Respect the operating temperature range
Each portable power station has a specified operating temperature range for charging and discharging. Typical ranges might be:
- Charging: around 32°F to 104°F (0°C to 40°C), sometimes with narrower limits for LiFePO4.
- Discharging: around 14°F to 104°F (-10°C to 40°C), with some variation.
Do not assume the discharge range equals the charge range. Charging is usually more restricted. If your environment is below the minimum charge temperature, let the unit warm up before connecting AC or solar input.
Avoid DIY heating methods
It is tempting to warm a cold battery with external heat, but many methods are unsafe. Avoid:
- Placing the power station directly against heaters or stoves.
- Using heating pads or blankets not designed for electronics.
- Covering air vents or blocking cooling paths to “trap” heat.
Instead, bring the unit into a temperature-controlled space and allow it to warm gradually. Some systems have built-in heaters managed by the BMS; rely on those rather than improvised external heat.
Do not bypass the BMS or open the case
Never attempt to open the power station to warm or charge the cells directly, bypass temperature sensors, or modify the battery pack. This can:
- Defeat over-temperature and low-temperature protections.
- Increase the risk of internal short circuits.
- Void warranties and create fire hazards.
If the unit repeatedly refuses to charge or operate within its stated temperature range, seek professional support instead of attempting internal repairs.
Use appropriate extension cords and placement
In cold-weather setups, you may place the power station indoors and run extension cords outdoors to loads. To stay safe:
- Use cords rated for outdoor use and appropriate current.
- Avoid running cords through door gaps where they can be pinched.
- Keep the power station on a dry, stable surface away from snow, ice, and condensation.
For any connection to home circuits, consult a qualified electrician and use approved transfer equipment. Do not attempt to wire a portable power station directly into a panel or backfeed outlets.
| Aspect | LiFePO4 | Typical lithium-ion (NMC/NCA) |
|---|---|---|
| Typical safe charge temp | ~32–113°F (0–45°C) | ~32–113°F (0–45°C) |
| Typical safe discharge temp | ~14–140°F (-10–60°C) | ~-4–140°F (-20–60°C) |
| Cold charging risk | High; plating risk below 32°F | High; plating risk below 32°F |
| Built-in heaters | Common in newer designs | Present in some models |
| Self-discharge in storage | Very low | Low to moderate |
Related guides: Winter Use: Why Charging Slows in Cold Weather and How to Plan Around It • Winter Storage Checklist: Keeping Batteries Healthy in the Cold • LiFePO4 vs NMC Batteries: Weight, Cold Performance, Safety, and Real Cycle Life Differences
Practical takeaways and cold-weather specs to compare
For cold climates, the choice between LiFePO4 and other lithium-ion chemistries comes down to priorities. LiFePO4 usually offers superior cycle life, stable voltage, and excellent long-term value, but feels the cold more in terms of immediate capacity and charge acceptance. Other lithium-ion chemistries can perform slightly better at very low temperatures in the short term but often wear out faster over years of use.
In real-world portable power station use:
- If you value long-term durability, frequent cycling, and predictable performance in moderate cold (around freezing), LiFePO4 is often attractive.
- If you need high surge output and are operating in more extreme cold, a well-managed lithium-ion system with robust BMS protections can deliver strong short-term performance, as long as you respect its charge limits.
In both cases, system design matters as much as chemistry. Battery heaters, conservative charge profiles, and accurate temperature sensing can dramatically improve cold-weather reliability.
Specs to look for
- Operating temperature range (charge/discharge) – Look for clearly stated charge and discharge ranges, for example, charging from 32–104°F (0–40°C). Wider, well-documented ranges indicate better cold-weather engineering.
- Low-temperature charge protection – Check for automatic charge cutoff or reduced current below freezing. This protects LiFePO4 and lithium-ion cells from plating damage in cold conditions.
- Integrated battery heating – Some units include self-heating that activates before charging in the cold. This feature can make winter solar or vehicle charging far more reliable.
- Rated cycle life at 80% capacity – Look for realistic cycle life numbers (for example, 2,000–4,000+ cycles) at standard depth of discharge. Higher values suggest the chemistry and BMS are optimized for longevity, especially important for LiFePO4.
- Usable capacity vs. rated capacity – Pay attention to whether the system allows deep discharge (for example, 80–90% usable) and how that holds up at low temperatures. Some systems reduce usable capacity aggressively in the cold.
- Continuous and surge output at low temps – If specified, compare continuous watts and surge watts at lower temperatures. This helps predict whether cold will cause early inverter shutdowns when starting motors or compressors.
- State-of-charge and temperature monitoring – A clear display showing battery percentage, estimated runtime, and internal temperature helps you adjust usage in cold weather before protections kick in.
- Self-discharge and standby drain – Look for low self-discharge rates and minimal idle consumption. This matters when leaving a power station in a cold garage or vehicle for weeks between uses.
- Recommended storage state of charge – Guidance such as storing at 40–60% charge at moderate temperatures indicates the manufacturer has considered long-term battery health, especially relevant for seasonal cold-weather users.
By focusing on these specs instead of just chemistry labels, you can choose a portable power station that stays dependable when temperatures drop, whether it uses LiFePO4 or another lithium-ion formulation.
Frequently asked questions
What specs and features should I prioritize for reliable cold-weather performance?
Look for a clearly stated operating temperature range for both charging and discharging, low-temperature charge protection, and whether the unit has integrated self-heating. Also compare usable capacity at low temperatures, continuous/surge output specs at cold temps, and clear state-of-charge and temperature monitoring on the display.
Is it OK to try charging a portable power station when it’s below freezing?
Generally no—charging below freezing can cause lithium plating on the anode and permanent capacity loss. Most modern BMSs will reduce charge current or block charging below safe thresholds; the safest approach is to warm the unit to the recommended charge temperature or use a system with managed heaters.
How can I manage battery temperature safely during winter use?
Keep the power station in a temperature-controlled space when possible, run loads or extension cords outdoors rather than moving the unit into cold conditions, and rely on built-in BMS heaters instead of improvised external heat sources. Follow the manufacturer’s guidance and avoid covering vents or placing the unit against high-heat surfaces.
Why does my power station show reduced runtime in cold weather even when the percentage seems high?
Cold increases internal resistance and causes greater voltage sag under load, so the pack can hit its low-voltage cutoff sooner even though the state-of-charge indicator still shows capacity. Warming the battery typically restores much of the apparent capacity.
What’s a common user mistake that shortens battery life in cold climates?
Forcing charges or bypassing BMS protections when the pack is cold is a common mistake that accelerates wear and can cause permanent damage. Long-term habits like regularly storing at 100% state of charge or repeatedly deep-discharging in cold conditions also reduce lifespan.
Recommended next:
- Battery Cycle Life Explained: What “Cycles” Really Mean
- Battery Management System (BMS) Explained: Protections Inside a Power Station
- LiFePO4 Charging Profile Explained (in Plain English)
- State of Charge (SOC) and Battery Calibration: Why Percent Readings Drift
- Idle Drain and “Phantom Loss”: Why Power Stations Lose Power When Not Used
- Temperature Limits Explained: Safe Charging/Discharging Ranges and What Happens Outside Them
- More in Battery →