Ground-fault circuit interrupter, or GFCI, protection is built into many portable power stations to reduce the risk of electric shock. The GFCI constantly compares the current flowing out on the hot wire with the current returning on the neutral wire. If it senses a difference beyond a small threshold, it shuts off power almost instantly.
When you plug in power tools, appliances, or extension cords, that protection sometimes “trips” even though nothing appears damaged. On a portable power station, this usually shows up as the AC output switching off or a warning indicator on the display. It can be confusing, especially if the same device works fine when plugged into a wall outlet.
Understanding why GFCI trips happen matters because it helps you separate real safety issues from nuisance trips. It also helps you size the power station correctly and choose better wiring and accessory practices so your tools and home essentials run more reliably during outages, camping, or remote work.
In this context, GFCI behavior connects directly with other basics such as watts, watt-hours, surge ratings, and inverter efficiency. A portable power station may shut down for different reasons: overload, low battery, inverter overheat, or GFCI trip. Knowing which is which is the key to safe and effective use.
To make sense of GFCI trips with power stations, it helps to separate three concepts: power (watts), energy (watt-hours), and how inverters and protective devices behave. Watts describe how fast a device uses power at a given moment. Watt-hours describe how much energy a battery can deliver over time.
What GFCI Tripping Means on Portable Power Stations
Portable power stations have two important watt limits: continuous (running) watts and surge watts. Running watts describe what the inverter can handle steadily. Surge watts describe short bursts when a motor or compressor starts. Power tools, refrigerators, pumps, and some electronics can draw 2–3 times their running wattage for a fraction of a second, which can lead to brief overloads, voltage dips, or inverter protection events.
GFCI protection is a separate layer from wattage limits. A GFCI trip is triggered by current imbalance, not by how many watts you are using. However, high startup currents, long extension cords, and certain power supplies can create small leakages or waveform distortions that look like a ground fault. Combined with inverter efficiency losses—typically 10–15% from battery to AC output—this can create situations where devices behave differently on a power station than on a utility outlet.
Efficiency losses also matter for sizing. If a device is rated at 500 watts, the power station may need to supply closer to 550–600 watts from the battery to cover inverter losses. That extra load adds heat and stress, which can make protective circuits more sensitive. When you plan capacity, it is wise to assume you will get somewhat less usable energy than the raw watt-hour rating suggests, especially at higher loads.
| What to check | Why it matters | Typical cue |
|---|---|---|
| Total running watts | Exceeding the continuous rating can cause overload shutdown, separate from GFCI. | Power station shows overload or immediately shuts off under load. |
| Startup (surge) load | Motors and compressors can draw 2–3x running watts briefly. | Device starts, clicks, then stops; lights flicker at start. |
| Extension cord length and gauge | Long or thin cords increase resistance and leakage paths. | Works fine when plugged directly into the power station but not with a long cord. |
| Moisture or outdoor use | Damp connectors and cords can create small ground faults. | GFCI trips more often outdoors or in damp areas. |
| Condition of tool or appliance | Worn insulation or damaged cords can leak current to ground. | GFCI trips on any GFCI-protected source, not just the power station. |
| Number of devices plugged in | Multiple small leakage currents can add up to one large trip. | Works alone, but trips when multiple AC devices are on together. |
| Power station temperature | High internal temperature can trigger protective shutdown. | Unit feels warm; fan runs often; shuts down under moderate load. |
| Battery state of charge | Low battery can cause voltage sag and protection events. | Shuts off sooner than expected or during heavy startup loads. |
Example values for illustration.
Key Concepts Behind GFCI, Watts, and Sizing Logic
To make sense of GFCI tripping with power stations, it helps to separate three concepts: power (watts), energy (watt-hours), and how inverters and protective devices behave. Watts describe how fast a device uses power at a given moment. Watt-hours describe how much energy a battery can deliver over time.
Portable power stations have two important watt limits: continuous (running) watts and surge watts. Running watts describe what the inverter can handle steadily. Surge watts describe short bursts when a motor or compressor starts. Power tools, refrigerators, pumps, and some electronics can draw 2–3 times their running wattage for a fraction of a second, which can lead to brief overloads, voltage dips, or inverter protection events.
GFCI protection is a separate layer from wattage limits. A GFCI trip is triggered by current imbalance, not by how many watts you are using. However, high startup currents, long extension cords, and certain power supplies can create small leakages or waveform distortions that look like a ground fault. Combined with inverter efficiency losses—typically 10–15% from battery to AC output—this can create situations where devices behave differently on a power station than on a utility outlet.
Efficiency losses also matter for sizing. If a device is rated at 500 watts, the power station may need to supply closer to 550–600 watts from the battery to cover inverter losses. That extra load adds heat and stress, which can make protective circuits more sensitive. When you plan capacity, it is wise to assume you will get somewhat less usable energy than the raw watt-hour rating suggests, especially at higher loads.
Real-World Examples of GFCI Tripping and Power Use
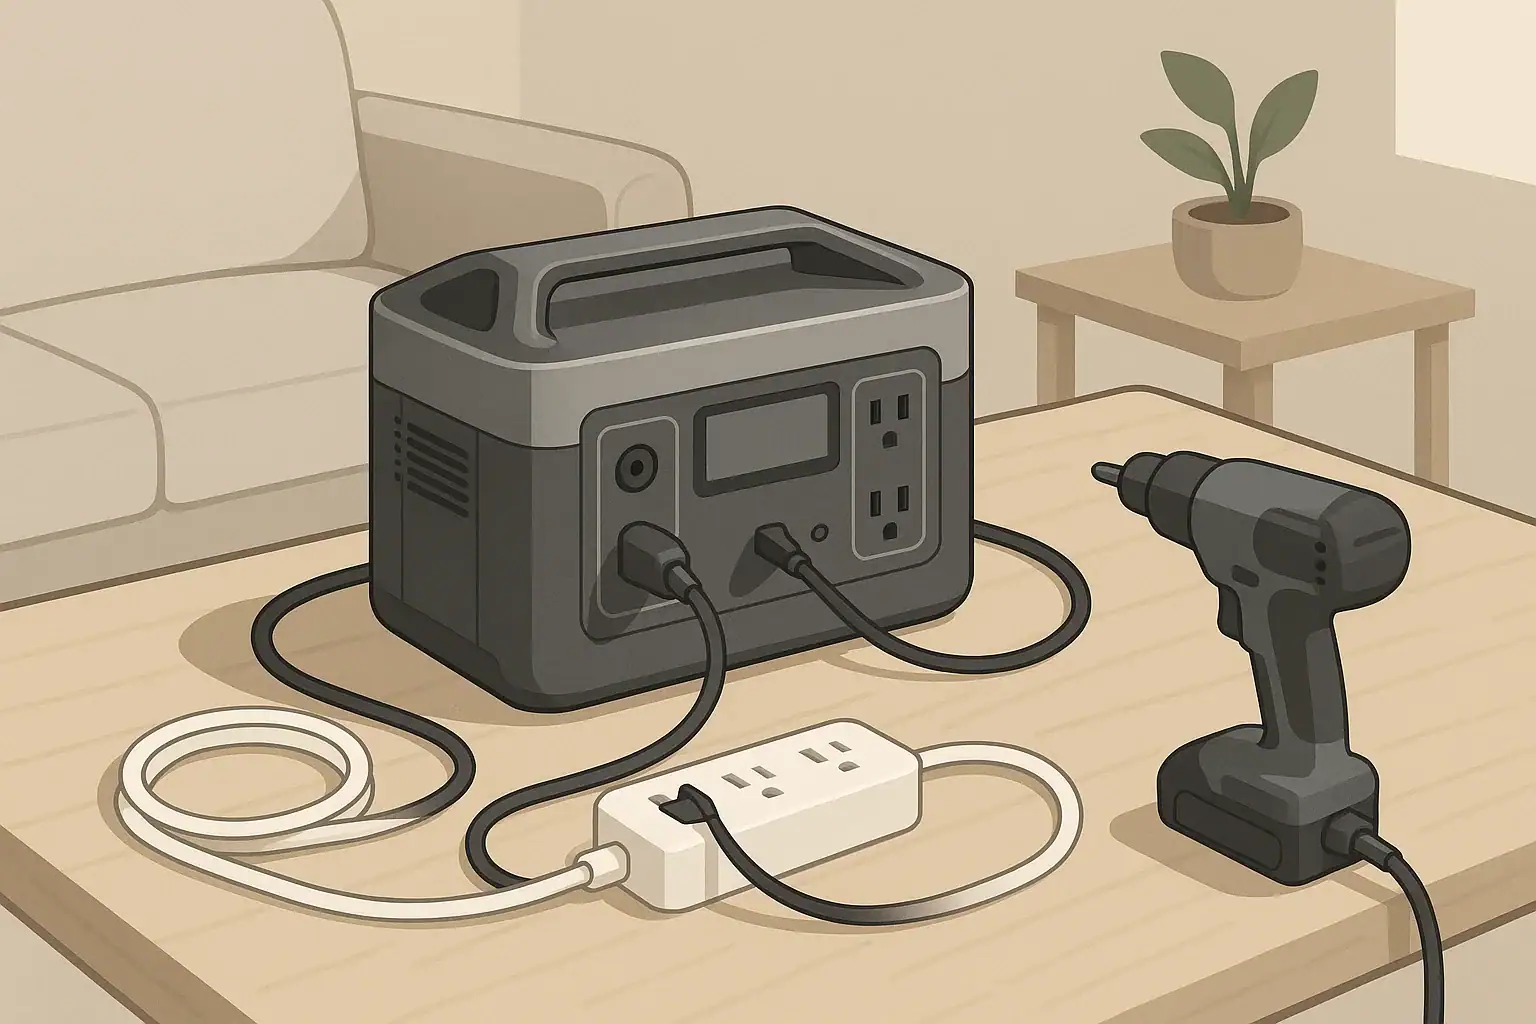
Consider a corded drill rated at 6 amps on 120 volts. In theory, that is about 720 watts while drilling under load. On startup or when it binds, it can briefly demand well over that. A medium portable power station with a continuous rating near that level may manage light work but shut down or trip as you push the drill harder, especially if you use a long extension cord through damp conditions.
A small air compressor might be labeled at 8 amps (around 960 watts) but surge to several times that when the motor and pump start. Plugged into a household GFCI outlet, it may work fine because of the wiring and grounding characteristics of the building circuit. On an isolated inverter output with built-in GFCI, the same compressor might cause nuisance trips if its motor or wiring leaks a small amount of current to its metal body or to ground through nearby surfaces.
Even non-motor loads can interact with GFCI and inverters. Some laptop power supplies, battery chargers, and LED lighting drivers use internal filters that bleed a tiny current to ground. When one device is plugged in, the leakage may be too low to matter. When you add several of these to a small power station, the combined leakage can reach the threshold that causes a GFCI trip, even though each individual device is within normal limits.
During a short power outage at home, you might run a refrigerator (with a compressor), a Wi‑Fi router, a laptop, and some LED lights from a single portable power station. The total running watts might be comfortably within the power station’s rating. Yet the combination of compressor surges, extension cords, and multiple electronic power supplies can occasionally trip the GFCI or overload protection, causing everything to shut off until you reset the unit.
Common Mistakes and Troubleshooting Cues
Many users assume that any shutdown means the battery is empty, but portable power stations can stop output for multiple reasons. A pure GFCI trip typically occurs suddenly when a device starts or when conditions change, even if the battery is still well charged. Overload or surge shutdown is more directly linked to watts, and thermal shutdown relates to heat buildup over time. Distinguishing these is the starting point for solving issues.
A common mistake is undersizing the power station for tools or appliances with motors. Choosing a power station based only on running watts without accounting for startup surge leads to frustrating trips. If your device’s label says 600 watts, and the power station’s continuous rating is 600 watts, there is little headroom for surge, heat, or inverter inefficiencies. You might see the AC output drop off just as the tool starts or when the refrigerator compressor kicks in.
Another frequent issue is using long, lightweight extension cords. These cords add resistance and introduce more opportunities for minor leakage or contact with moisture, which can trigger GFCI. If a device trips only when using a particular cord, that cord might be damaged, undersized, or poorly suited to the load. Keeping runs as short as practical and using cords rated for the current you need can reduce both voltage drop and nuisance trips.
Look for patterns when troubleshooting. If the GFCI trips whenever a certain tool starts, that tool may have internal leakage or insulation wear. If shutdowns happen mainly when multiple small devices are connected, the combined leakage current or total watts may be too high. If the power station feels hot and the fan runs constantly before shutdown, temperature is likely part of the problem. Paying attention to these cues helps you decide whether to change cords, reduce loads, move the unit for better cooling, or have a tool inspected.
Safety Basics: Placement, Ventilation, Cords, Heat, and GFCI
GFCI protection is one element of a broader safety picture around portable power stations. These units should be placed on stable, dry surfaces, away from standing water, open containers of liquid, or damp ground. Indoors, avoid blocking the air inlets and outlets that the cooling fan depends on. Outdoors, protect the unit from rain and heavy condensation, even if its enclosure is rated for some level of weather resistance.
Ventilation is important because inverters and batteries generate heat under load. If a power station is tucked into a tight cabinet or surrounded by gear, internal temperatures rise faster. That can lead to derating of output capacity, earlier shutdown, or accelerated battery wear. Give the unit several inches of clearance on all sides and avoid covering it with blankets, clothing, or bags while in use or charging.
Extension cords and power strips should match the load. Use cords with appropriate gauge wire for the current you expect and keep them as short as reasonably possible. Inspect cords regularly for cuts, crushed sections, or damaged plugs. Do not run cords through standing water, and avoid daisy-chaining multiple power strips. When GFCI tripping becomes frequent, inspect all cords and connections for damage and consider using fewer adapters and splitters.
At a high level, GFCI exists to reduce the risk of shock. If you consistently see GFCI trips with a particular tool or appliance on any GFCI-protected source, consider having that device inspected or replaced. For more complex setups—such as using a portable power station alongside an RV electrical system or in a building with existing GFCI and other protection—consult a qualified electrician. Avoid any attempt to bypass grounding pins, defeat GFCI functions, or modify the internal wiring of power stations or appliances.
Maintenance and Storage for Reliable Operation
Good maintenance and storage habits support both safety and predictable runtime. Most portable power stations perform best when stored with a moderate state of charge, often somewhere in the middle of their range rather than completely full or empty. Over long periods, batteries self-discharge slowly, so a unit left unused for many months can drop low enough that it refuses to start without a careful recharge.
Temperature strongly affects both battery health and GFCI behavior. Extreme cold can temporarily reduce available capacity and cause devices to draw higher currents as they struggle to start. Excessive heat can accelerate internal aging and make protective circuits more sensitive. Storing and using the power station within a moderate temperature range helps keep runtimes consistent and reduces the likelihood of nuisance shutdowns under load.
Routine checks are straightforward but important. Periodically inspect AC outlets, USB ports, and DC jacks for debris, corrosion, or looseness. Make sure ventilation grills are free of dust buildup. Check cords and commonly used tools for damage, especially those that have previously caused GFCI trips. Many power stations offer a way to run a basic self-test or show error codes; learn what those indicators mean in general terms so you can respond appropriately.
Charging practices also matter for longevity. Avoid letting the battery sit at 0% for long periods, and do not rely constantly on very fast charging if your schedule allows slower, cooler charging cycles. When storing the unit for a season, bring it back to a moderate state of charge every few months. This reduces stress on the battery and helps ensure the power station is ready when you need it for outages, trips, or projects.
| Task | Suggested frequency | Notes |
|---|---|---|
| Top up battery charge to a moderate level | Every 3–6 months in storage | Helps offset self-discharge and keeps cells balanced. |
| Inspect cords and plugs | Before major trips or outage seasons | Look for damage that can increase GFCI tripping risk. |
| Clean ventilation openings | Every few months or after dusty use | Prevents overheating and thermal shutdowns. |
| Test key appliances on the power station | Once or twice a year | Confirms compatibility and checks for nuisance trips. |
| Store in temperature-controlled space | During off-season | Avoid prolonged exposure to high heat or freezing. |
| Review indicator lights and basic error codes | When first setting up and after updates | Helps distinguish GFCI trips from overload or low battery. |
| Check for physical damage to outlets | Annually or after impacts | Cracked housings or loose outlets may be unsafe. |
| Verify charger and cables | When charging behavior changes | Loose or damaged chargers can slow charging or cause faults. |
Example values for illustration.
Practical Takeaways and Checklist
Managing GFCI tripping and shutdowns on portable power stations comes down to understanding load behavior, wiring quality, and environmental conditions. When you recognize how power tools, appliances, and electronics interact with a small inverter-based system, it becomes easier to plan realistic runtimes and avoid surprises.
Rather than treating every shutdown as a defect, use it as information. Identify whether you are seeing GFCI trips, overloads, thermal limits, or low-battery protection. Then adjust how you size, place, and maintain the power station and connected devices.
- Match the power station’s continuous and surge ratings to your highest-demand tool or appliance, leaving comfortable headroom.
- Use short, properly rated extension cords and avoid damaged or questionable cords that can contribute to GFCI trips.
- Keep the power station dry, well ventilated, and within moderate temperature ranges during use and storage.
- Test critical devices on the power station before relying on them during an outage or trip.
- Inspect any tool or appliance that repeatedly trips GFCI protection, even on other circuits, and consider professional evaluation.
- Maintain a moderate state of charge during long-term storage and refresh the battery periodically.
- Consult a qualified electrician for complex setups involving RVs or building wiring, and do not modify internal wiring or safety systems.
With these practices, you can use portable power stations more confidently, keeping GFCI protection working for your safety while minimizing nuisance trips that interrupt your work and daily life.
Frequently asked questions
Why does a portable power station’s GFCI trip when I start a power tool?
GFCI trips occur when the device senses a current imbalance between hot and neutral, not simply high wattage. Motor startup surges, waveform distortion from the inverter, tiny leakage from tool filters, or increased resistance from long/poor cords can create conditions that the GFCI interprets as a fault and trips. Check surge capacity, use a short heavy-gauge cord, and test the tool on a known-good outlet to isolate the cause.
How can I tell if the unit shut down from a GFCI trip versus overload or thermal protection?
GFCI trips are usually sudden and often accompany a visible GFCI or fault indicator on the unit; overloads commonly trigger an overload indicator or immediate shutdown when the load exceeds the continuous rating; thermal issues are often preceded by increased fan activity and elevated temperature before derating or shutdown. Consult the station’s status lights or error codes for the precise meaning and the manual for reset procedures.
Can several small devices together cause GFCI tripping on a power station?
Yes. Multiple small electronics with EMI filters or chargers can each leak a tiny current to ground, and those leakage currents can add up to exceed the GFCI threshold. If trips only happen when multiple items are connected, try removing some devices or redistributing loads to reduce combined leakage.
Do long or thin extension cords increase the chance of GFCI tripping on power stations?
Long or undersized cords increase resistance, voltage drop, and the chance of insulation breakdown or moisture ingress, all of which can contribute to leakage paths or inverter distortion that look like ground faults. Use the shortest, appropriately gauged cord for the current and inspect cords for damage to reduce nuisance trips.
What safe steps reduce nuisance GFCI trips without disabling protection?
Do not bypass safety devices. Instead, ensure the power station has adequate surge headroom for motors, use proper-gauge short cords, keep the unit dry and well ventilated, inspect and repair tools or cords that leak, and test devices on a different GFCI-protected source to identify problematic equipment. For complex or persistent issues, consult a qualified electrician or service technician.